Fig. 2
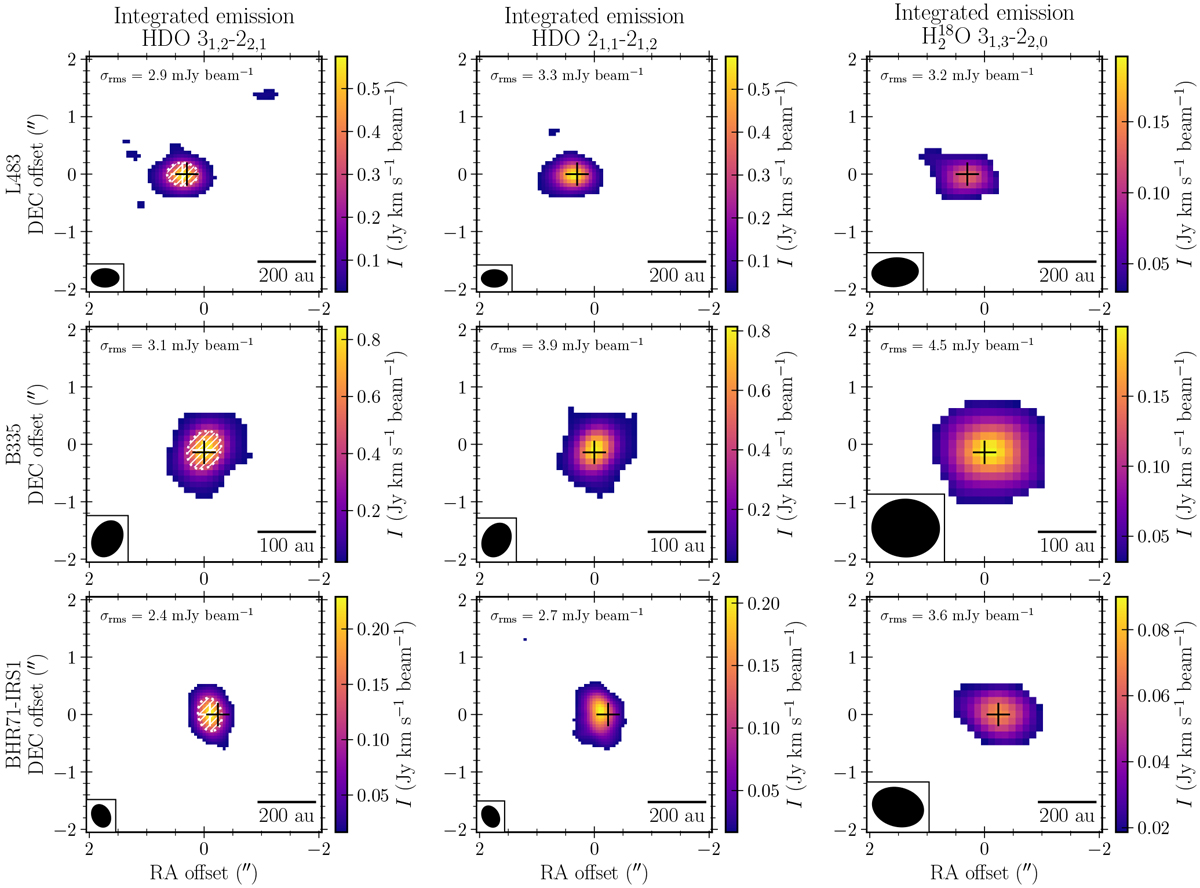
Integrated emission for the targeted water transitions toward each of the sources. Left column: HDO 31,2 –22,1 transition at 225.9 GHz. The white shaded regions show the FWHM extent of a 2D Gaussian fitted to the data in the image plane and the white cross indicates the peak position of the fit. Middle column: HDO 21,1 –21,2 transition at 241.6 GHz. Right column: H![]() O
31,3 –22,0
transition at 203.4 GHz. Emission below 5σ
is not included, where
O
31,3 –22,0
transition at 203.4 GHz. Emission below 5σ
is not included, where ![]() ; dv is the channel width and N is the number of collapsed channels. The black cross marks the 202.7 GHz continuum peak position toward which the spectra are extracted.
; dv is the channel width and N is the number of collapsed channels. The black cross marks the 202.7 GHz continuum peak position toward which the spectra are extracted.
Current usage metrics show cumulative count of Article Views (full-text article views including HTML views, PDF and ePub downloads, according to the available data) and Abstracts Views on Vision4Press platform.
Data correspond to usage on the plateform after 2015. The current usage metrics is available 48-96 hours after online publication and is updated daily on week days.
Initial download of the metrics may take a while.