Fig. 1
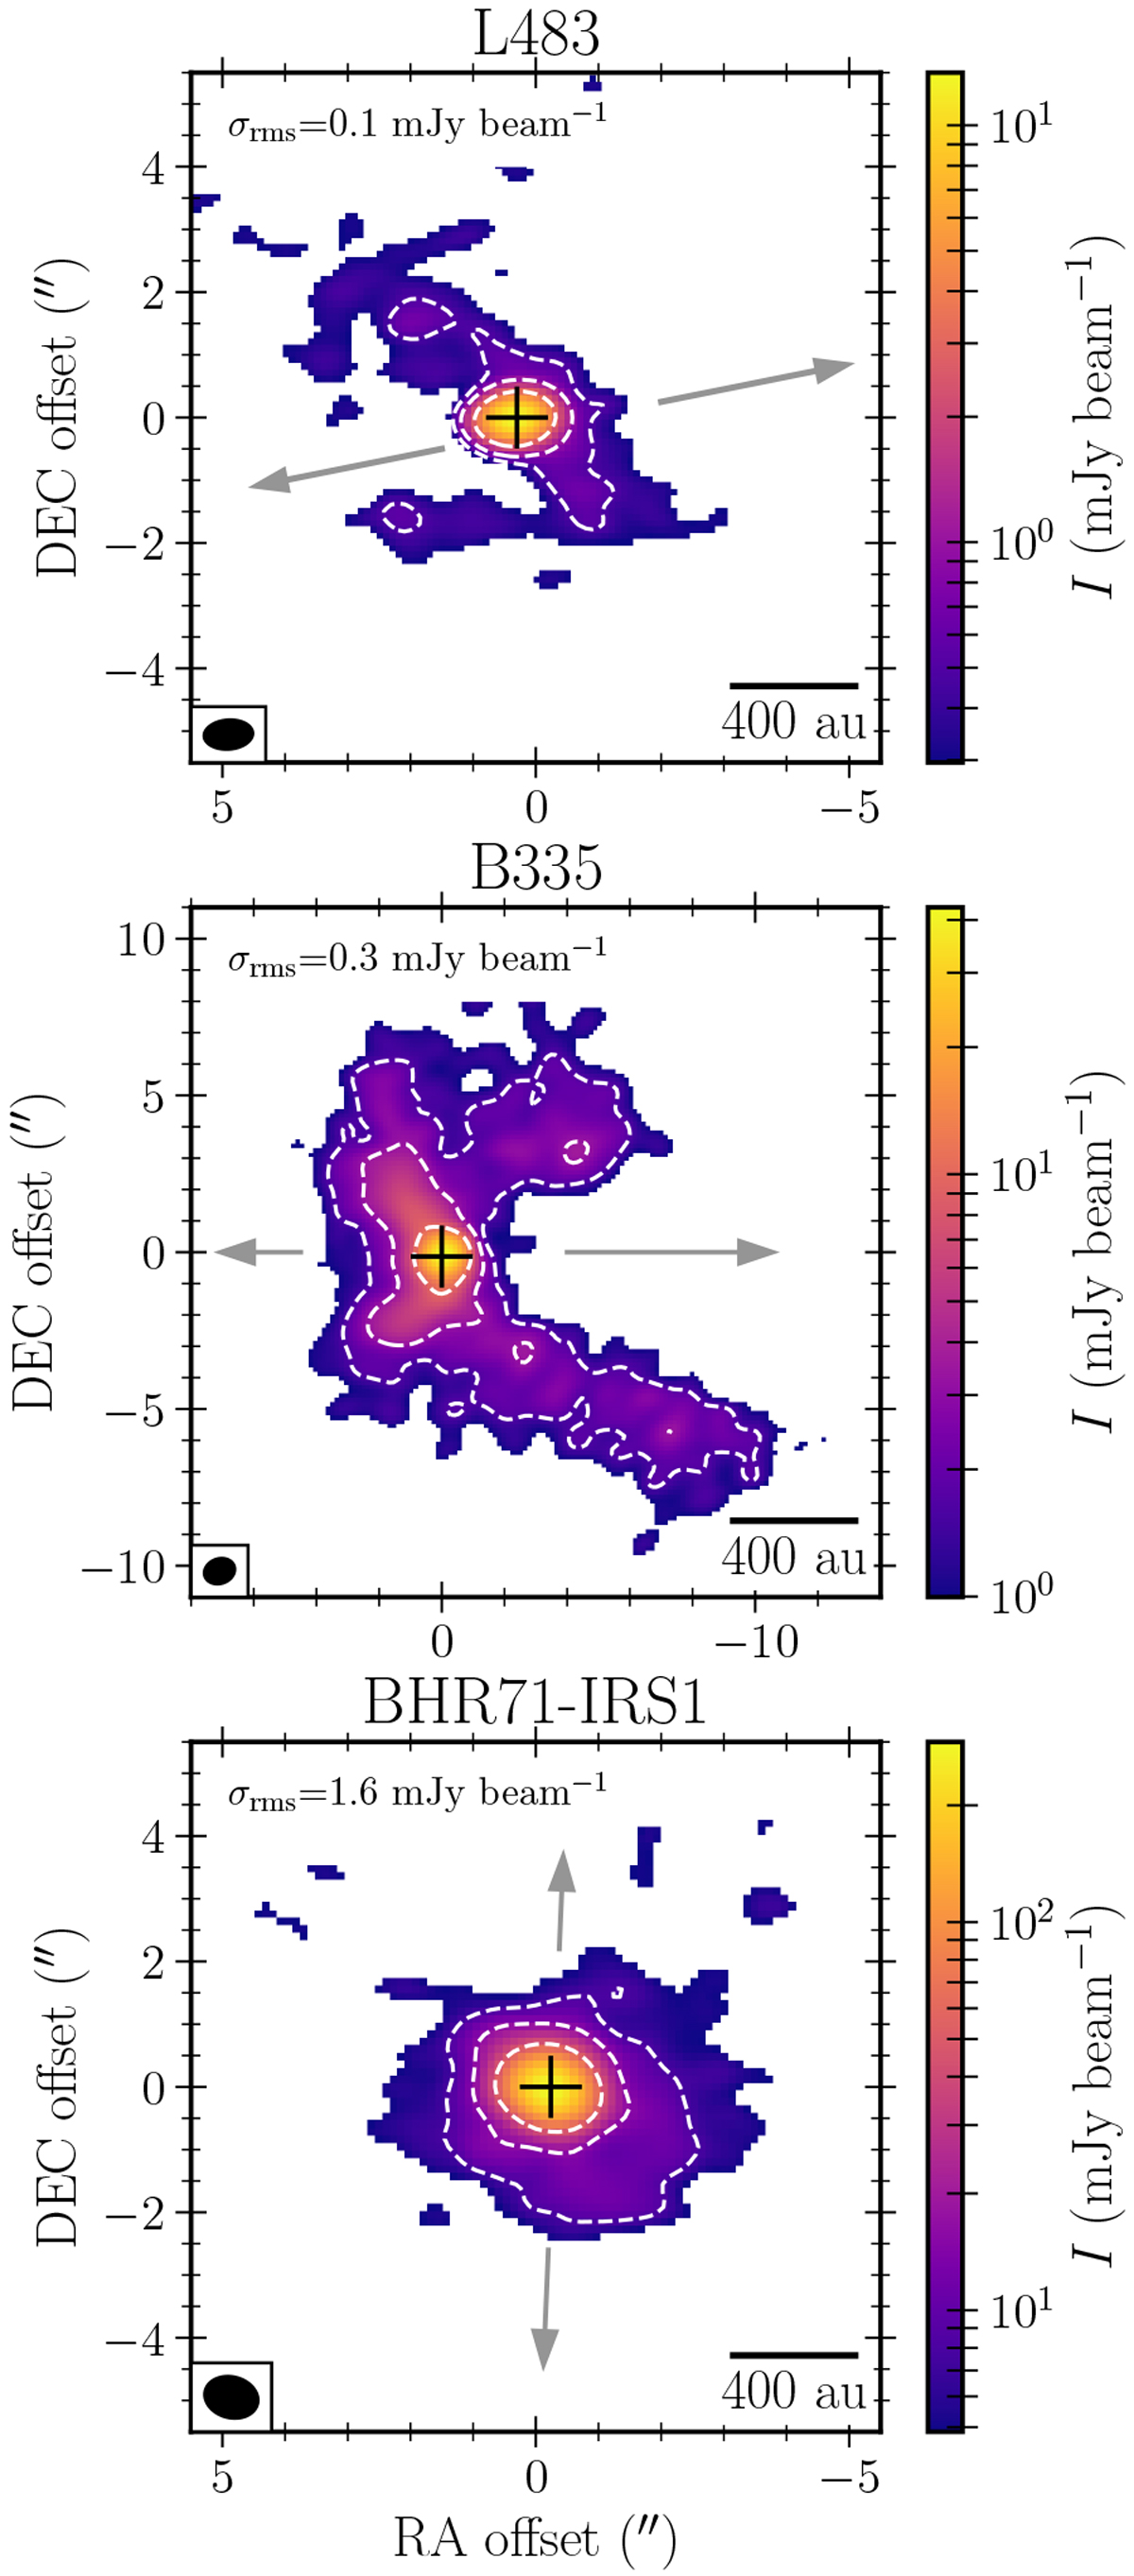
Continuum emission at 202.7 GHz toward the three sources. The map shows emission above 3σrms with white contours at 5σrms, 10σrms, and 30σrms. The maps are presented on same linear scale. The black cross marks the peak location and the grey arrows indicate the potential direction of outflows which may be perturbing the dust distribution. For BHR71–IRS1 the grey arrows indicates the outflow direction presented by Benedettini et al. (2017) and Yang et al. (2017).
Current usage metrics show cumulative count of Article Views (full-text article views including HTML views, PDF and ePub downloads, according to the available data) and Abstracts Views on Vision4Press platform.
Data correspond to usage on the plateform after 2015. The current usage metrics is available 48-96 hours after online publication and is updated daily on week days.
Initial download of the metrics may take a while.