Fig. 7.
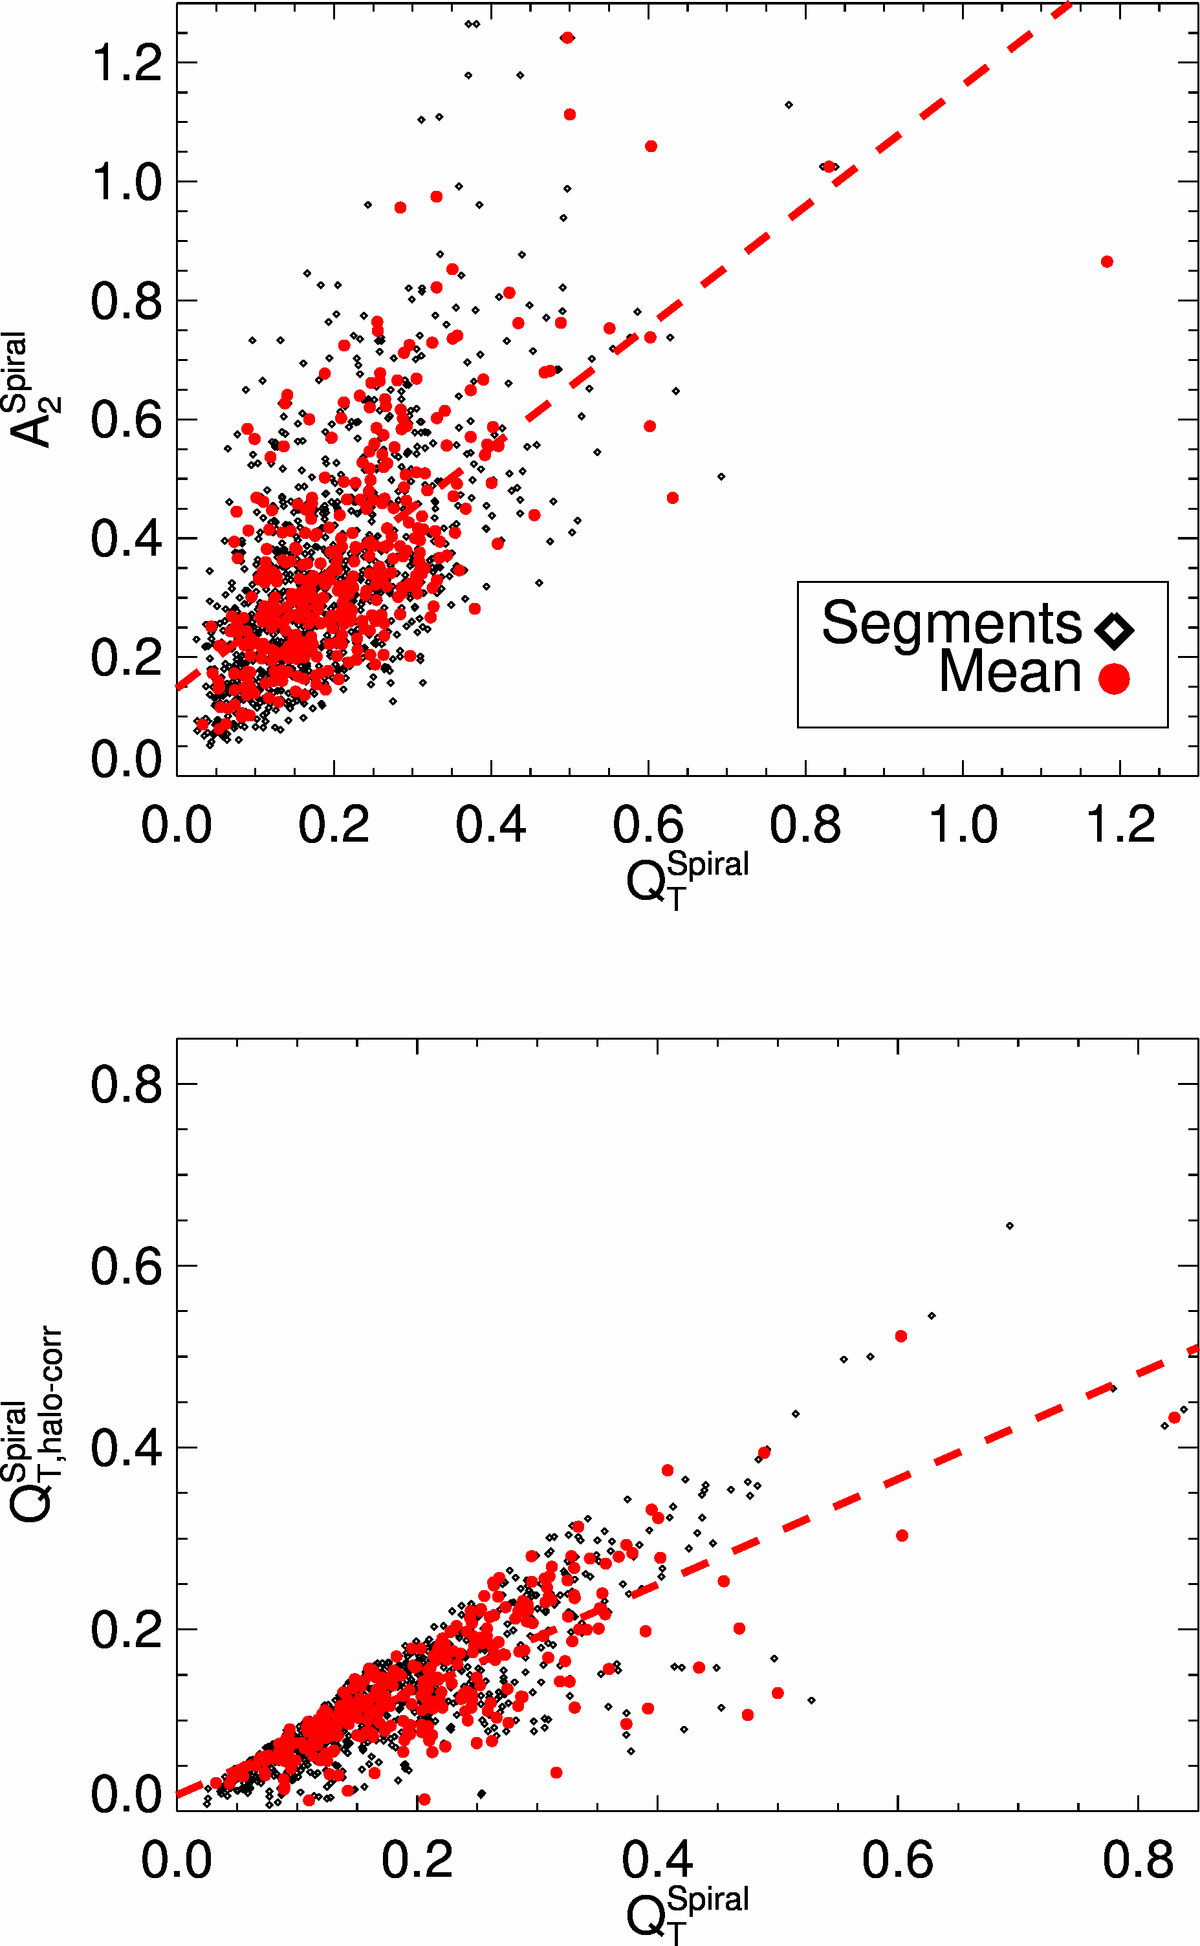
Comparison between the proxies of the amplitude of the spirals used in this work (Eqs. (9)–(11)). We show the mean value per galaxy, and measurements over individual segments. The Spearman’s rank correlation coefficients (significances) are 0.62 (4.14 × 10−43) and 0.82 (0.0) for the upper and lower panels, respectively. With a red dashed line we show the linear fit to the red data points.
Current usage metrics show cumulative count of Article Views (full-text article views including HTML views, PDF and ePub downloads, according to the available data) and Abstracts Views on Vision4Press platform.
Data correspond to usage on the plateform after 2015. The current usage metrics is available 48-96 hours after online publication and is updated daily on week days.
Initial download of the metrics may take a while.