Fig. 3.
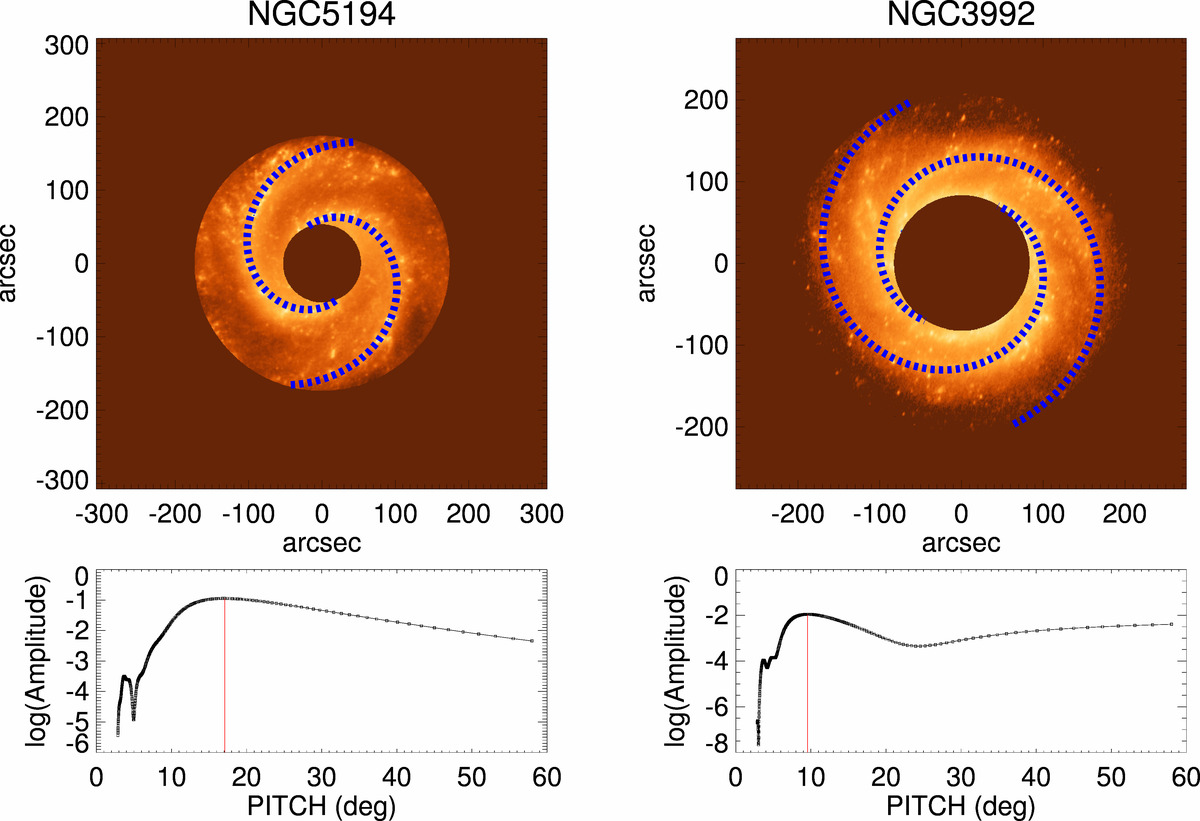
Upper panels: logarithmic fit to the spiral arms in the de-projected 3.6 μm image of NGC 5194 (left) (only central parts considered) (18–23 μ3.6μm (AB) magnitude scale) and NGC 3992 (right) (21–25 μ3.6μm (AB) magnitude scale), using 2D Fourier transform spectral analysis (see text). Lower panels: logarithm of the m = 2 Fourier amplitude as a function of the pitch angle for the two galaxies shown above. The vertical line denotes the maximum value, that determines the global pitch angle assigned to the galaxy.
Current usage metrics show cumulative count of Article Views (full-text article views including HTML views, PDF and ePub downloads, according to the available data) and Abstracts Views on Vision4Press platform.
Data correspond to usage on the plateform after 2015. The current usage metrics is available 48-96 hours after online publication and is updated daily on week days.
Initial download of the metrics may take a while.