Fig. D.1.
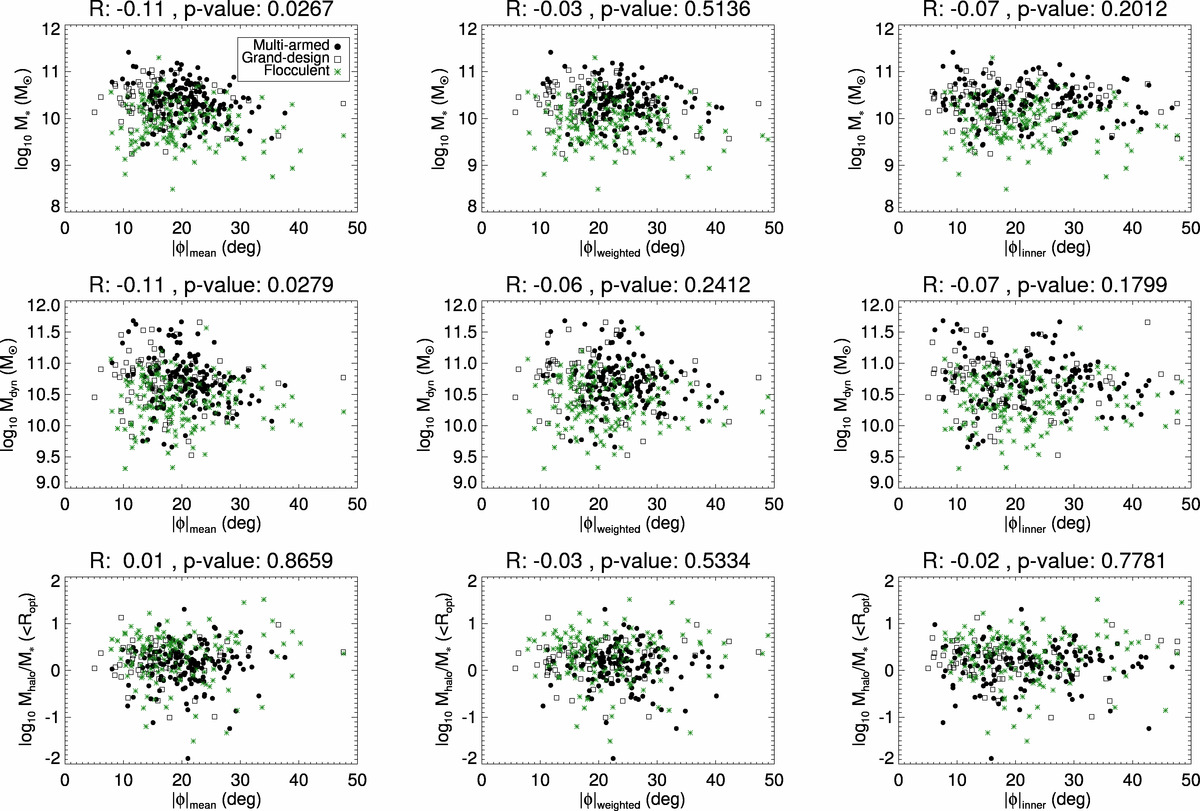
Galaxy mass versus pitch angle. We plot the total stellar mass (upper row), dynamical mass (central row), and halo-to-stellar mass ratio (lower row) versus the mean pitch angle (left column), mean weighted by the arc length of the arms (central column), and mean of the innermost logarithmic segments (right column). Different colours and symbols represent different types of spirals, as indicated in the legend of the upper left panel (as in Fig. 14).
Current usage metrics show cumulative count of Article Views (full-text article views including HTML views, PDF and ePub downloads, according to the available data) and Abstracts Views on Vision4Press platform.
Data correspond to usage on the plateform after 2015. The current usage metrics is available 48-96 hours after online publication and is updated daily on week days.
Initial download of the metrics may take a while.