Fig. 2.
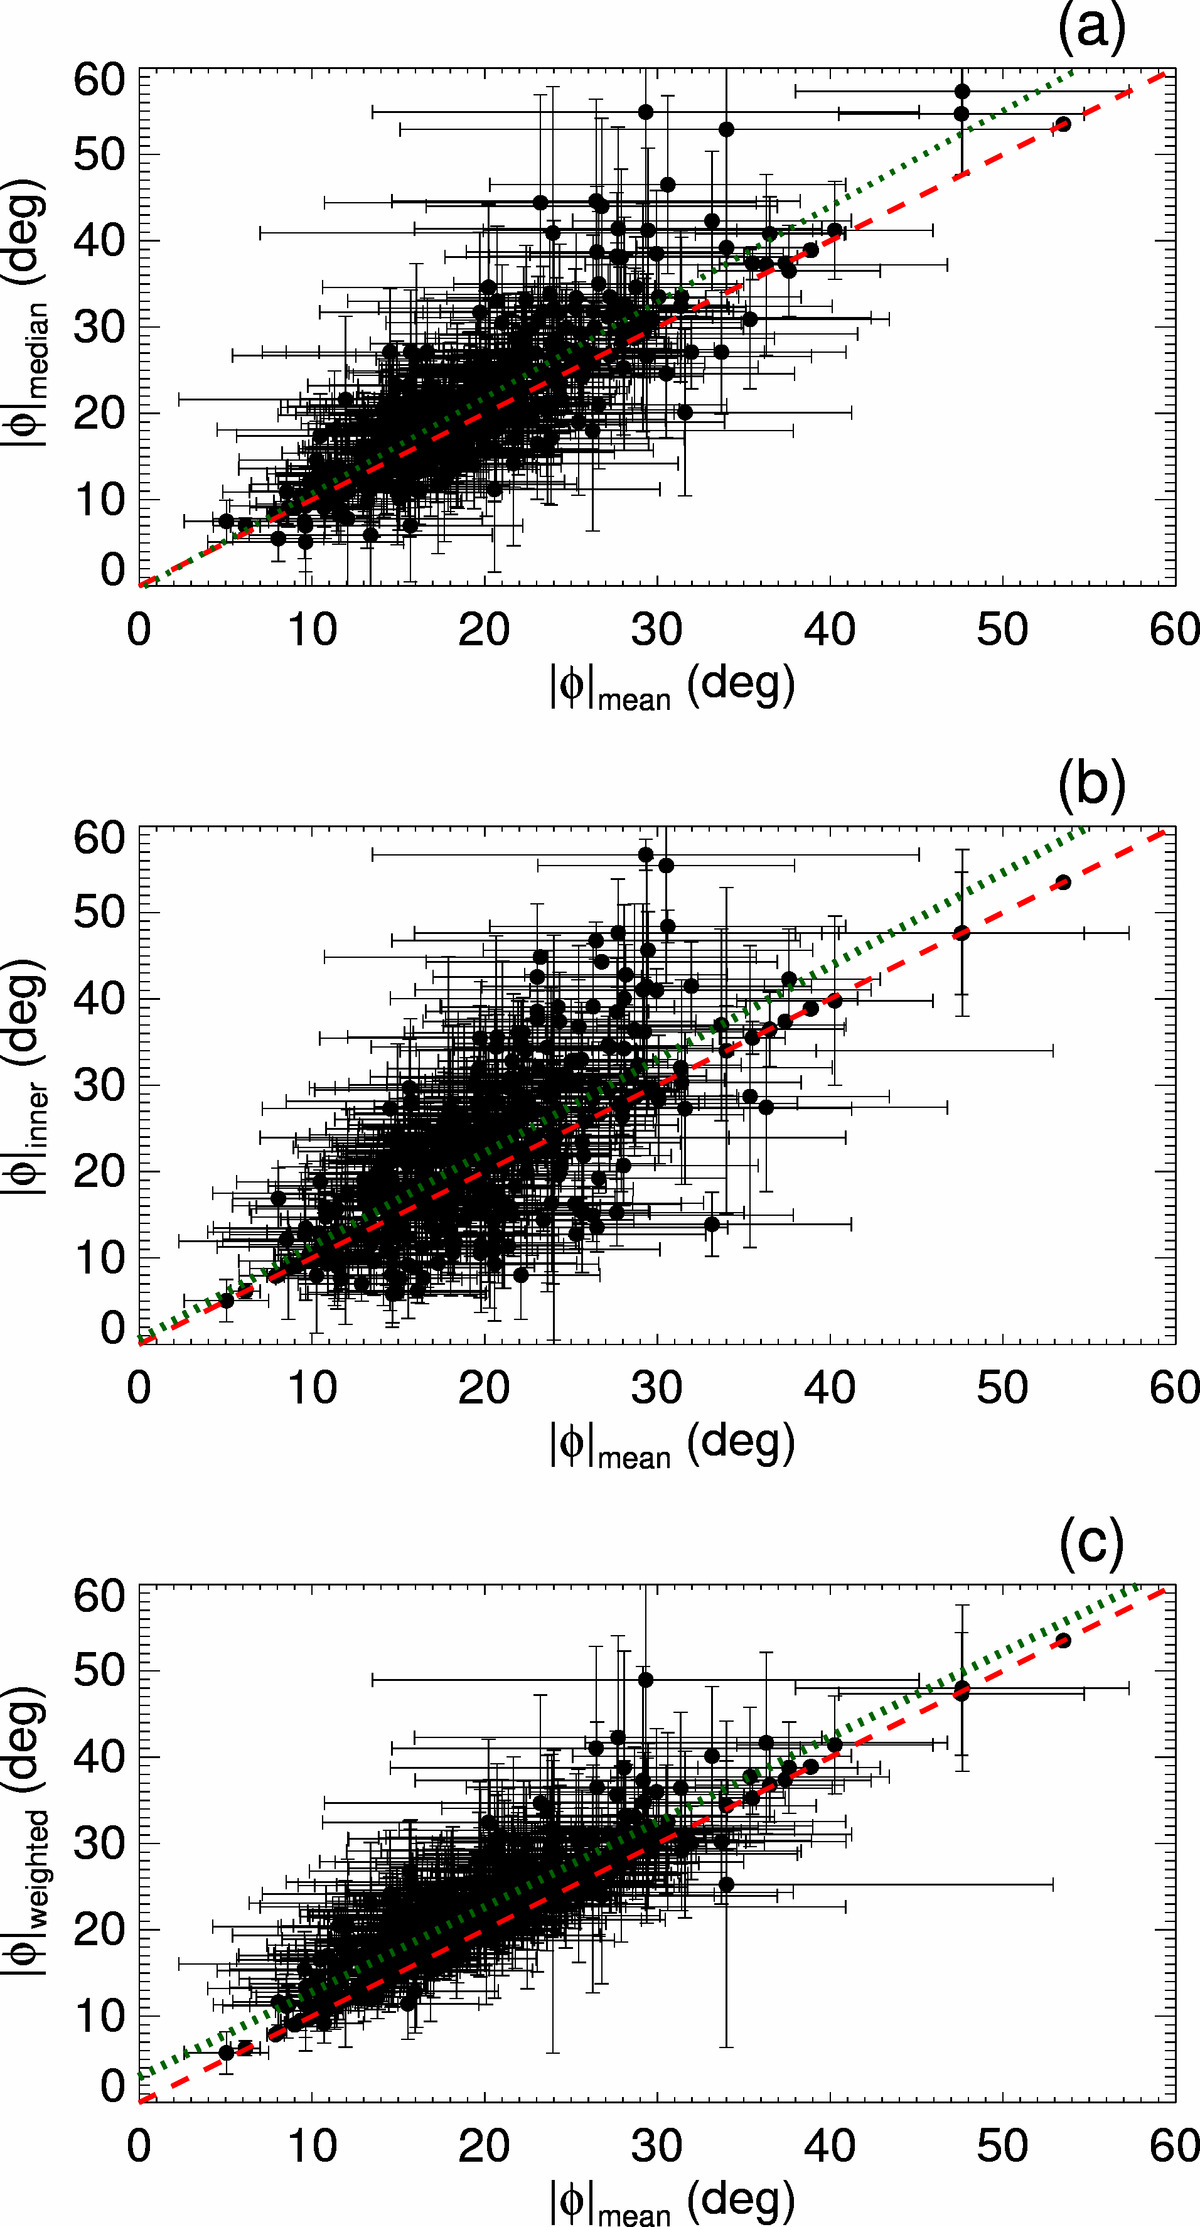
Comparison between mean and (a) median pitch angle, (b) mean of the innermost logarithmic segments, and (c) mean weighted by the arc length of the arms. The y = x straight line is shown in red, and the dotted green line shows the linear fit to the cloud of points. Error bars indicate the standard deviation of the mean calculated from the segments fitted in each galaxy.
Current usage metrics show cumulative count of Article Views (full-text article views including HTML views, PDF and ePub downloads, according to the available data) and Abstracts Views on Vision4Press platform.
Data correspond to usage on the plateform after 2015. The current usage metrics is available 48-96 hours after online publication and is updated daily on week days.
Initial download of the metrics may take a while.