Fig. 14.
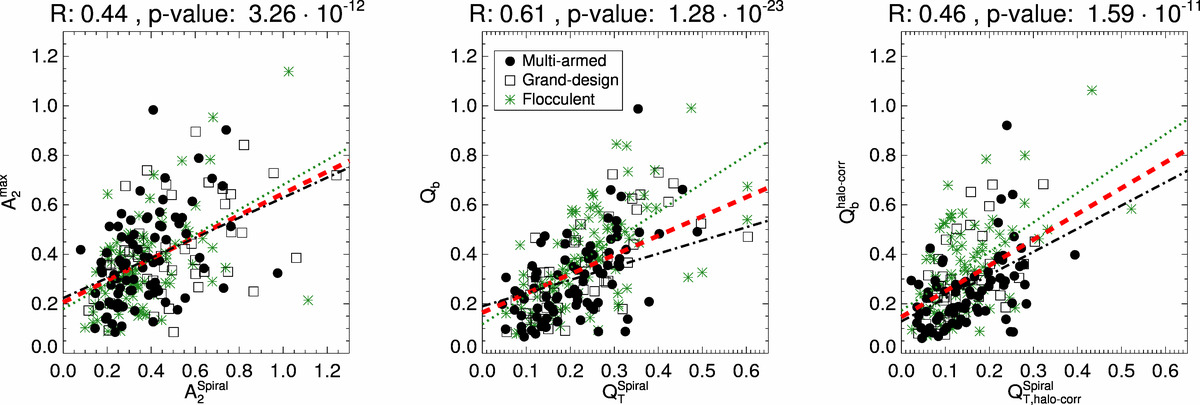
Bar strength (from Díaz-García et al. 2016a) as a function of spiral strength, measured from m = 2 Fourier amplitudes (Eq. (11)) (left), from tangential-to-radial forces (Eq. (9)) (middle), also including the correction for the halo dilution (Eq. (10)) (right). Different types of spirals are plotted with different symbols, as indicated in the legend. The red dashed line shows the linear fit to the cloud of points (in green and black we show the fit for flocculent and grand-design+multi-armed, respectively).
Current usage metrics show cumulative count of Article Views (full-text article views including HTML views, PDF and ePub downloads, according to the available data) and Abstracts Views on Vision4Press platform.
Data correspond to usage on the plateform after 2015. The current usage metrics is available 48-96 hours after online publication and is updated daily on week days.
Initial download of the metrics may take a while.