Fig. 13.
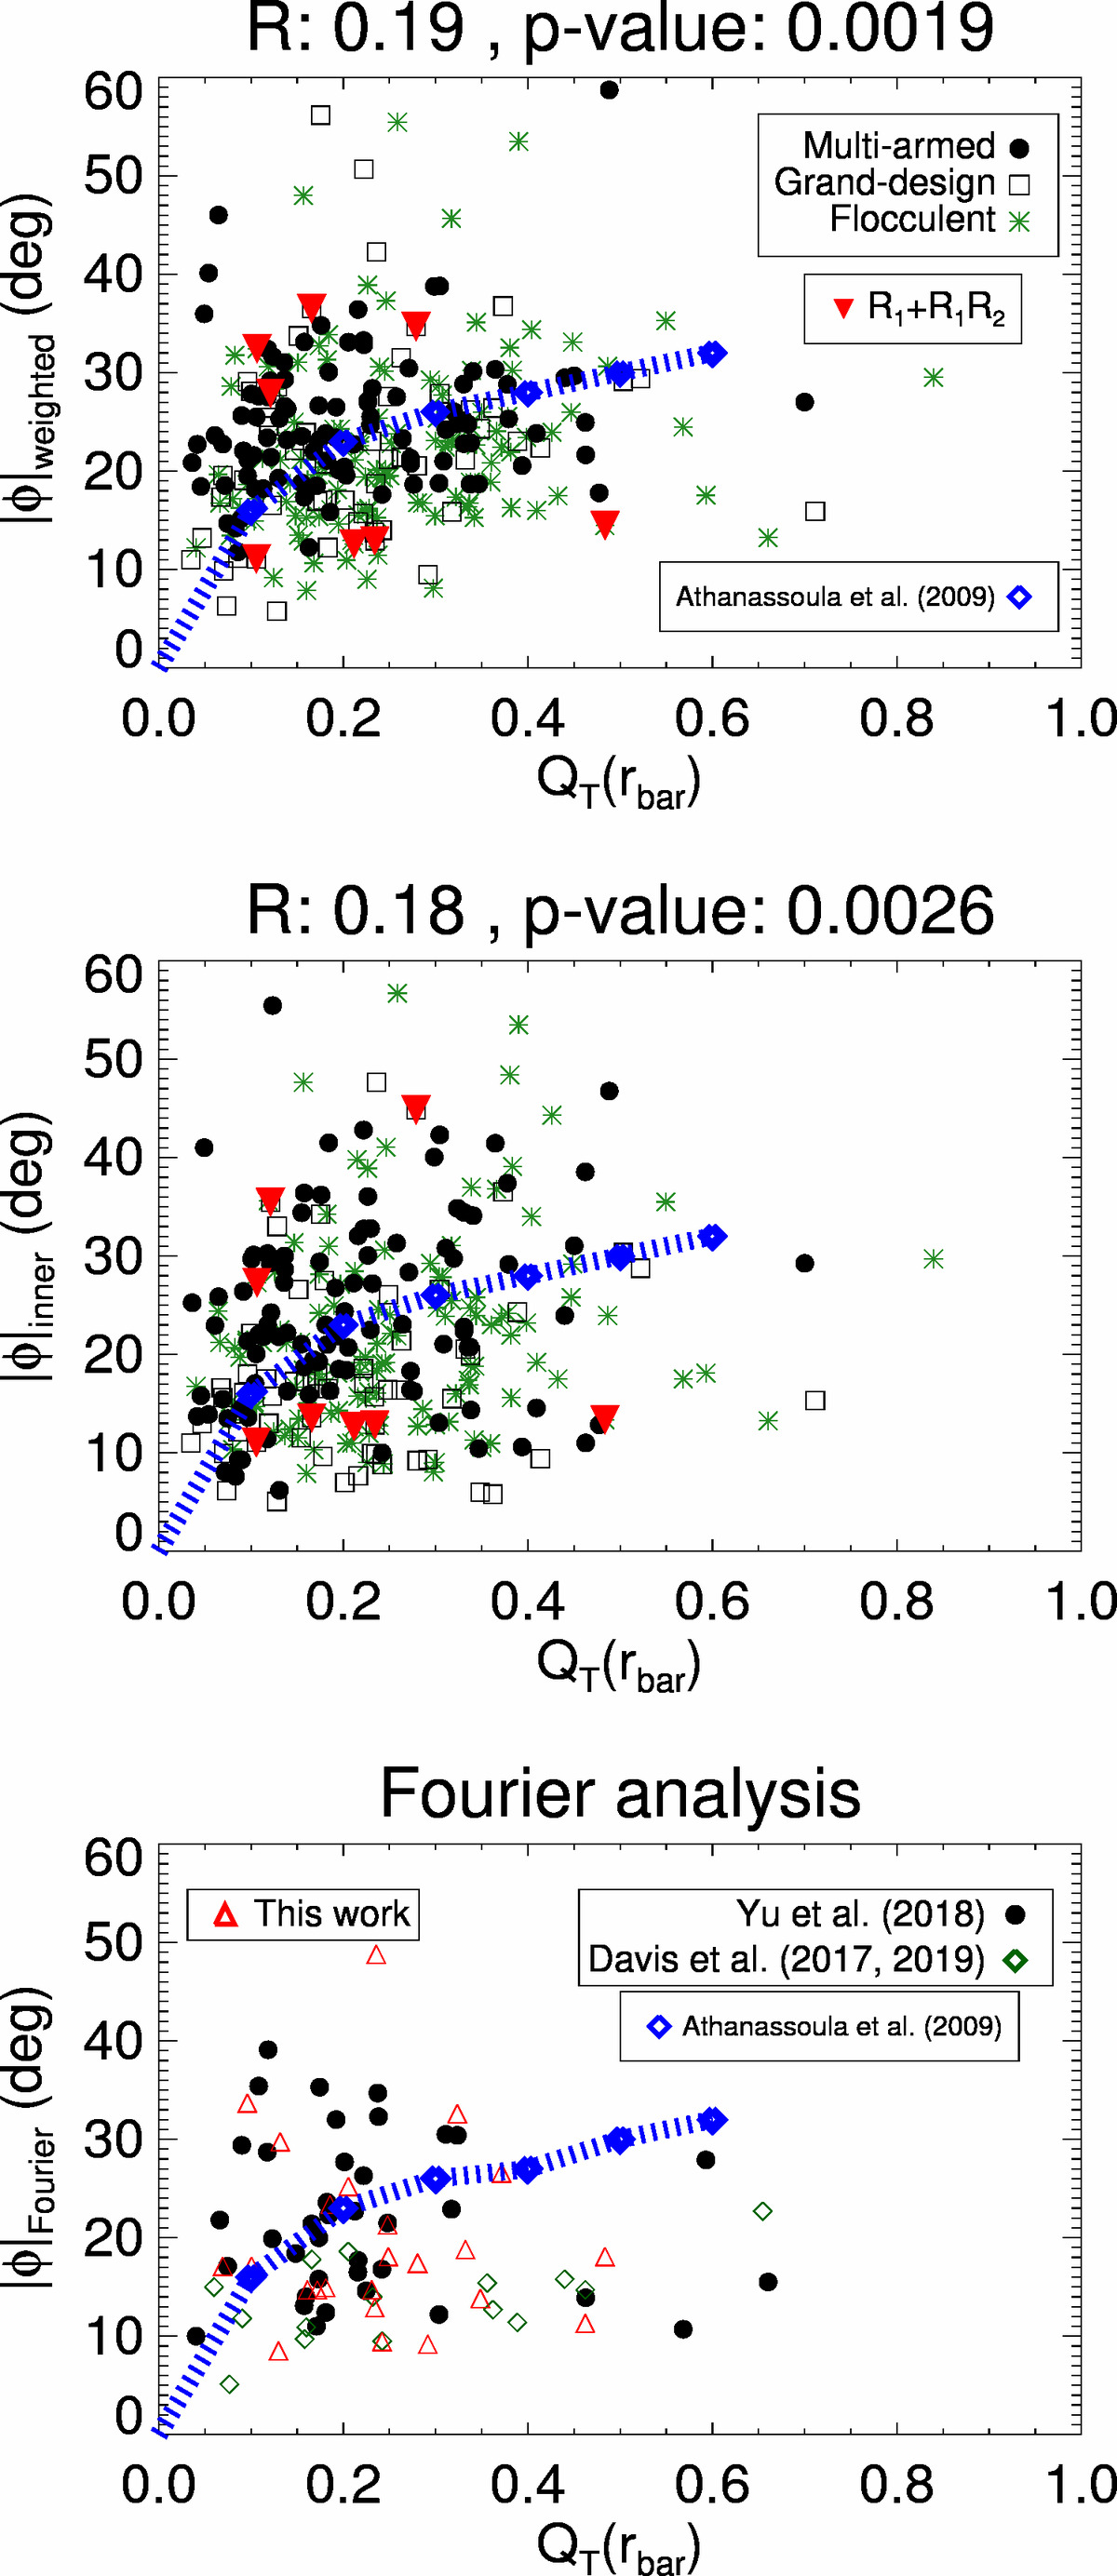
Weighted mean pitch angle (upper panel) and mean of the innermost spiral segments (middle panel) versus tangential-to-radial forces evaluated at the bar radius. The blue diamonds and line outline the trend in the simulations by Athanassoula et al. (2009b) for QT (L1). With red triangles we show the few galaxies in our sample hosting outer rings of type R1 or R1R2. On the lower panel we show the same plot but using pitch angles obtained via 2D Fourier analysis from this work and from the literature, using the measurements from Yu et al. (2018) (black points), and from Davis et al. (2017, 2019) (green diamonds).
Current usage metrics show cumulative count of Article Views (full-text article views including HTML views, PDF and ePub downloads, according to the available data) and Abstracts Views on Vision4Press platform.
Data correspond to usage on the plateform after 2015. The current usage metrics is available 48-96 hours after online publication and is updated daily on week days.
Initial download of the metrics may take a while.