Fig. 12.
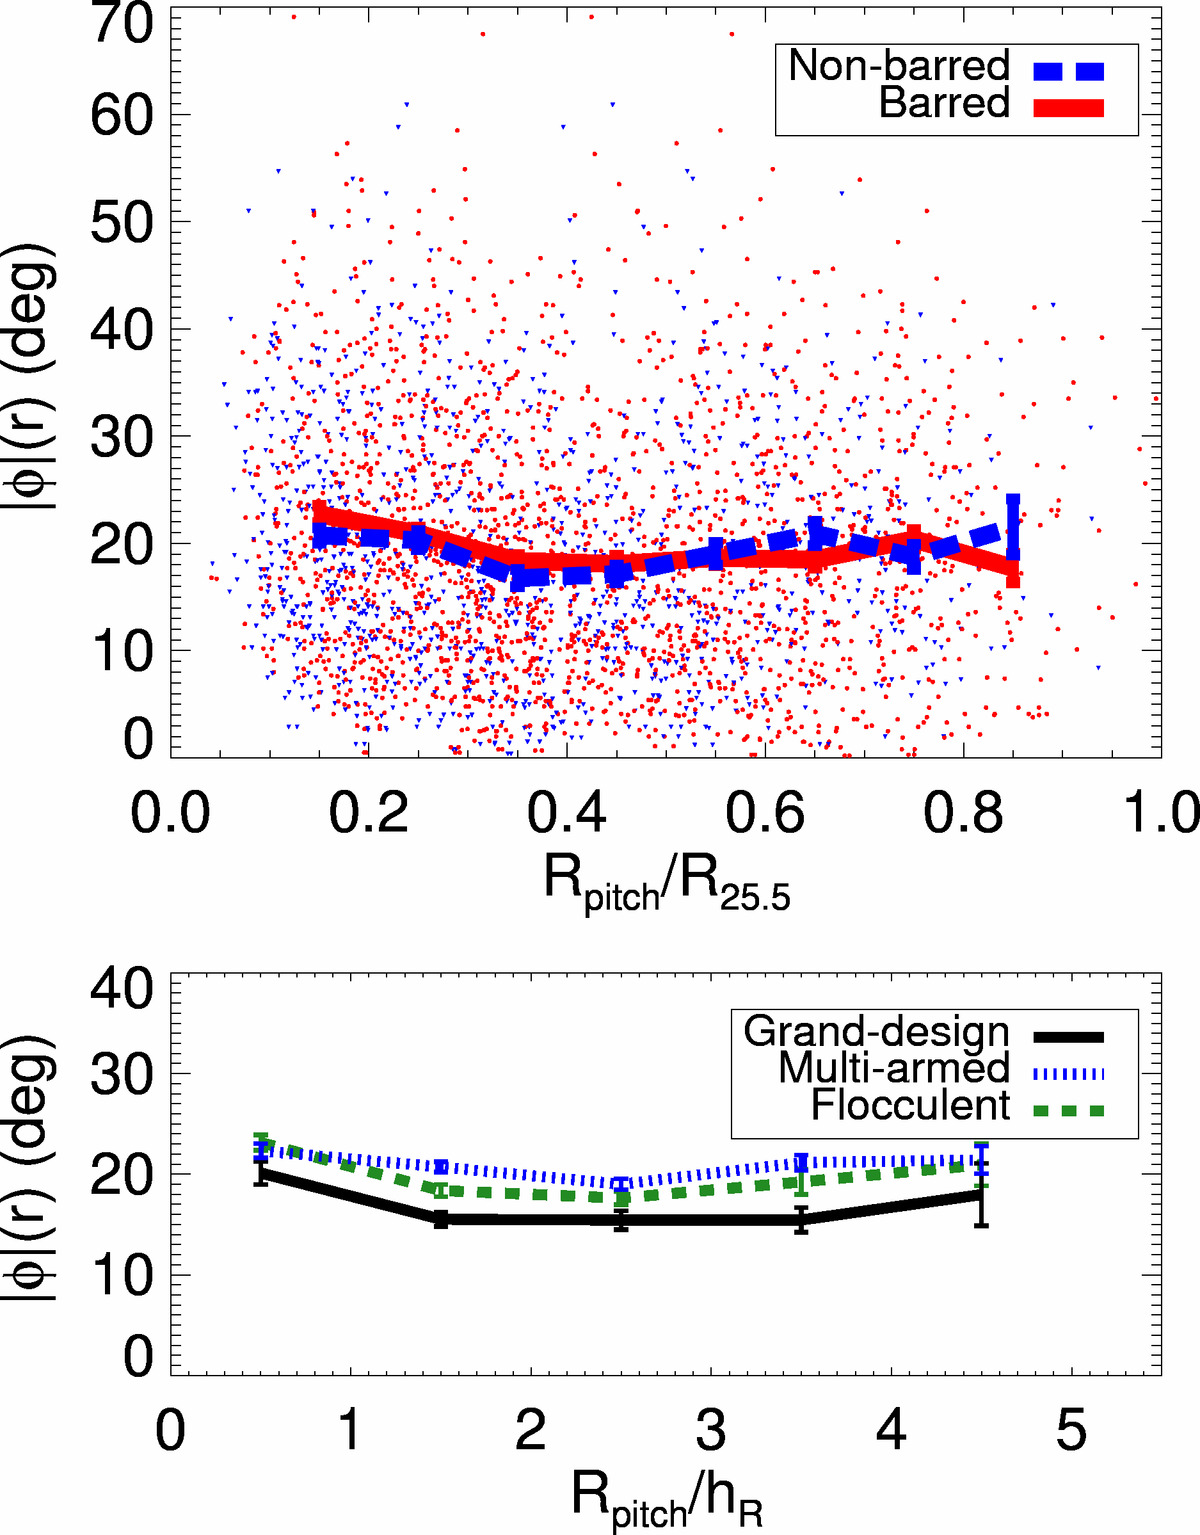
Upper panel: radial variation of the pitch angle based on the individual measurements of logarithmic segments by Herrera-Endoqui et al. (2015). In the x-axis we plot the boundaries of the radial interval where the pitch was measured, normalised by the 25.5 mag arcsec−2 isophotal radius. The lines correspond to the running mean (bin size of 0.1), and the error bars are the standards deviation of the mean (the values appear listed in Table 3). Barred and non-barred galaxies are plotted separately. Lower panel: same as above but using the disc scale-length for the normalization, and showing only the running mean (bin size of 1, see Table 4). The colours indicate flocculent, multi-armed, and grand-design galaxies, as indicated in the legend.
Current usage metrics show cumulative count of Article Views (full-text article views including HTML views, PDF and ePub downloads, according to the available data) and Abstracts Views on Vision4Press platform.
Data correspond to usage on the plateform after 2015. The current usage metrics is available 48-96 hours after online publication and is updated daily on week days.
Initial download of the metrics may take a while.