Fig. 11.
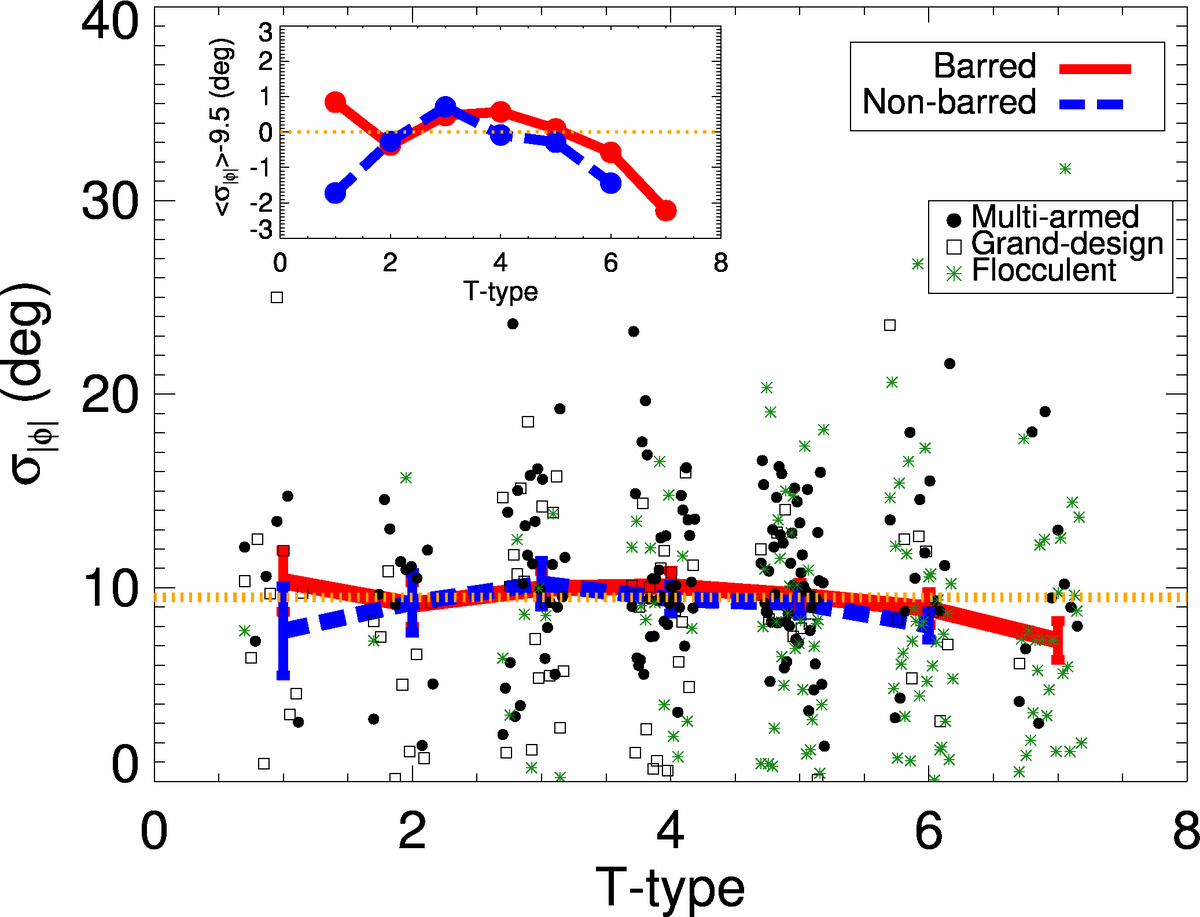
As in Fig. 10, but for the standard deviation of |ϕ| in each of the galaxies. The lines indicate the running median per T-type for barred and non-barred galaxies, and the vertical lines correspond to the standard deviation of the mean. The horizontal orange dotted line traces the mean σ|ϕ| (≈9.5°). Mean residual differences with respect to this value for each T bin (typically ≲2°) are shown in the inner panel on the upper left corner.
Current usage metrics show cumulative count of Article Views (full-text article views including HTML views, PDF and ePub downloads, according to the available data) and Abstracts Views on Vision4Press platform.
Data correspond to usage on the plateform after 2015. The current usage metrics is available 48-96 hours after online publication and is updated daily on week days.
Initial download of the metrics may take a while.