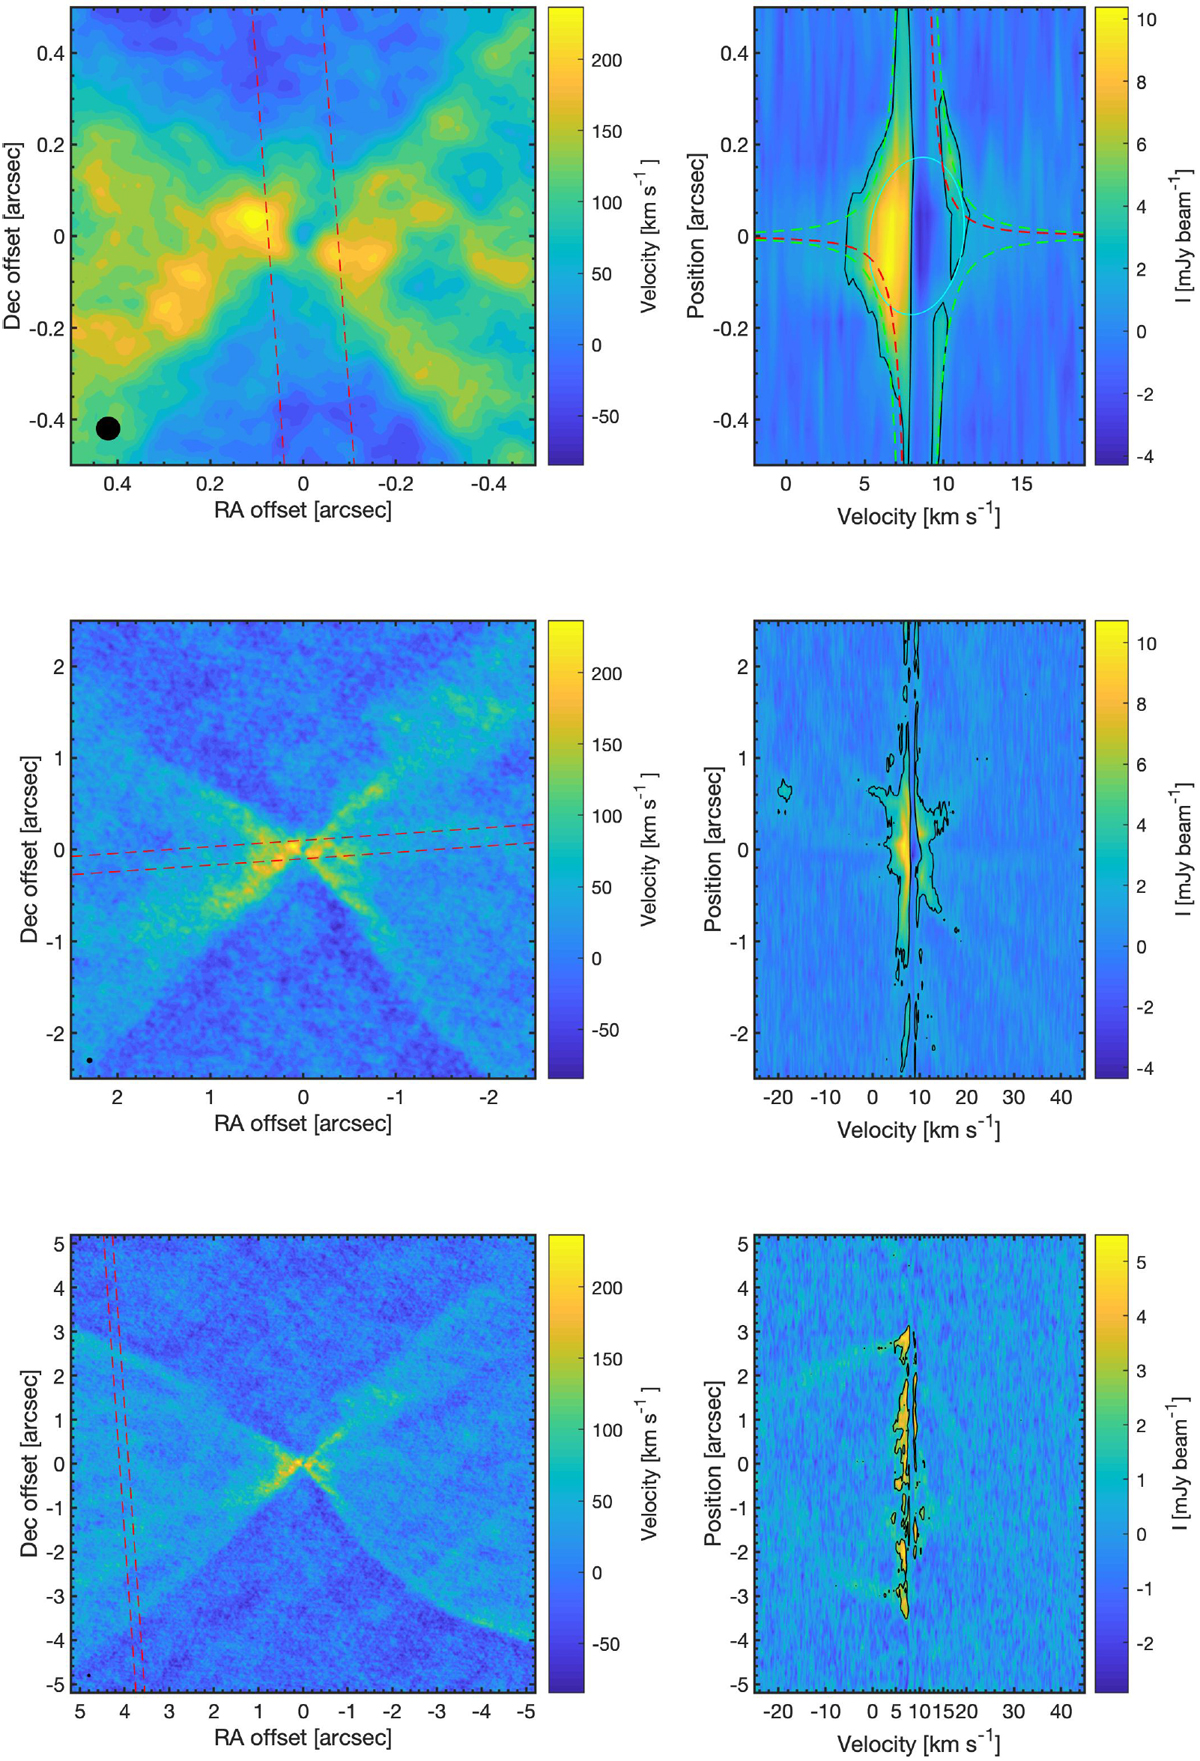
Fig. 9

12CO integrated emission and PV diagrams. Left panels: moment 0 maps of the 12CO emission (within ± 5 km s−1 from the systemic velocity) overlaid with the orientation and width of each PV cut. The maps were convolved with a 2D Gaussian to 5 au resolution to improve the S/N. Right panels: PV diagrams for 12CO along the different cuts shown in the left panels. Contours are at 3σ. In the upper right panel, green and red dashed lines denote pure free-fall and Keplerian rotational velocities towards/around a 0.05 M⊙ protostar, respectively. An example of a 2D Gaussian fit (see Sect. 4.4) to the emission is indicated by the cyan ellipse. Note the change in scale from top to bottom rows.
Current usage metrics show cumulative count of Article Views (full-text article views including HTML views, PDF and ePub downloads, according to the available data) and Abstracts Views on Vision4Press platform.
Data correspond to usage on the plateform after 2015. The current usage metrics is available 48-96 hours after online publication and is updated daily on week days.
Initial download of the metrics may take a while.


