Fig. 8
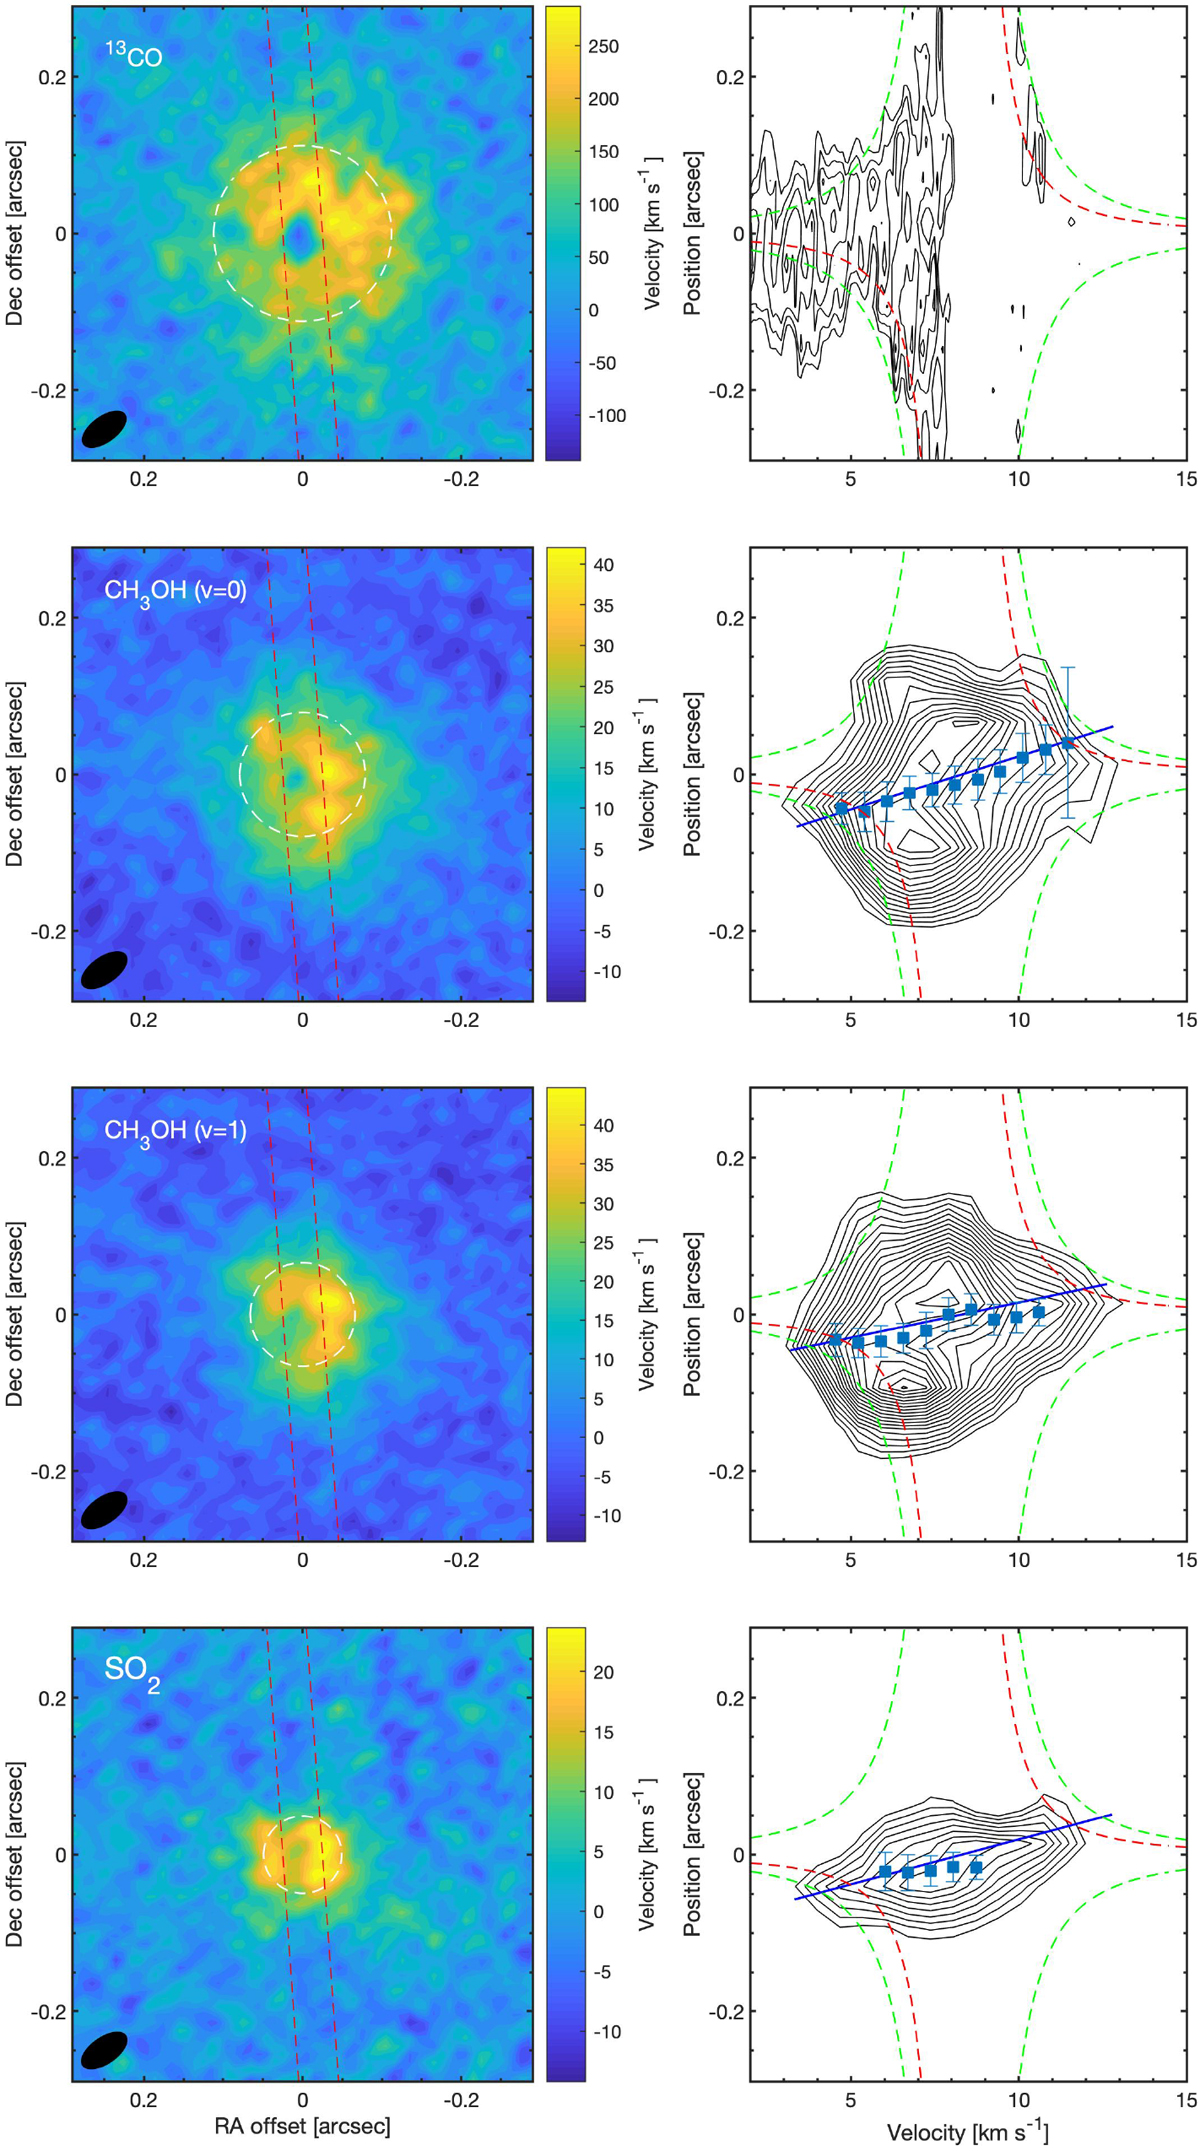
13CO, CH3 OH (v = 0,1), and SO2 integrated emission and PV diagrams. Left panels: emission integrated over 10 km s−1 centred on the systemic velocity. White dashed circles denote the FWHM of 2D Gaussian fits to the emission, while the red dashed lines indicate the direction and width of the PV cuts. The same PV cut is used in all panels. Synthesizedbeams are shown in the lower left corners. Right panels: resulting PV diagrams. Blue dots denote the location of emission peaks at a particular velocity (only velocity channels where the coefficient of determination, R2, is larger than 0.3 are included). A linear fit to the peak emission velocity profile is represented by the blue line. Pure free-fall and pure Keplerian rotation velocities towards/around a 0.05 M⊙ protostar are indicated in the right panels by the green and red dashed lines, respectively.
Current usage metrics show cumulative count of Article Views (full-text article views including HTML views, PDF and ePub downloads, according to the available data) and Abstracts Views on Vision4Press platform.
Data correspond to usage on the plateform after 2015. The current usage metrics is available 48-96 hours after online publication and is updated daily on week days.
Initial download of the metrics may take a while.