Fig. 4
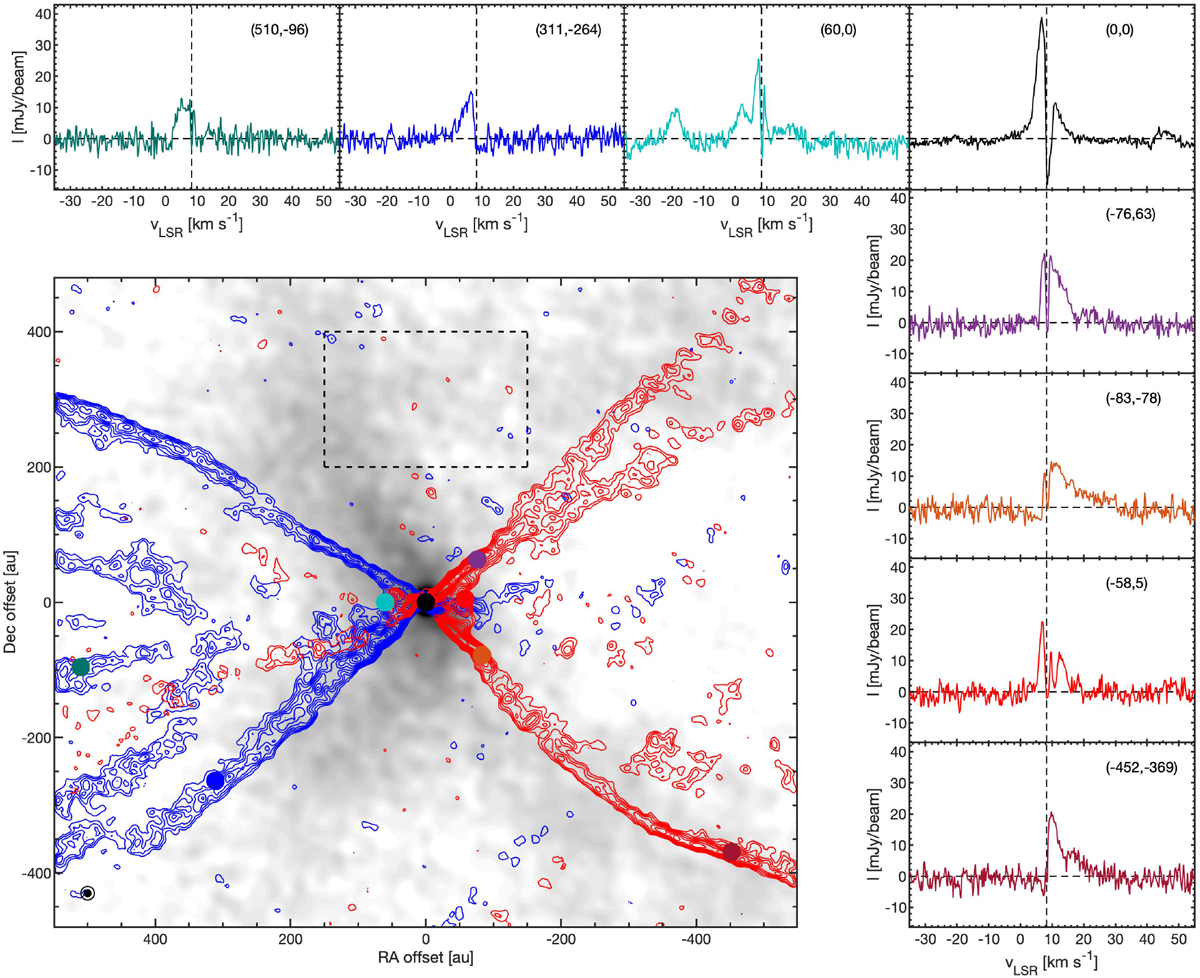
Moment 0 map of the 12CO emission (contours from 3σ in steps of 1σ, where σ = 5.6 mJy beam−1), overlaid on the continuum (greyscale from 0 to 25% of maximum), in the combined data set. The 12CO image was convolved with a 2D Gaussian to 10 au resolution to enhance the S/N in the map, while the continuum was convolved with a 2D Gaussian to 20 au resolution. The emission is integrated from 2.0–6.0 km s−1 with respect to the source velocity, 8.3 km s−1 w.r.t. υLSR. The dashed box denotes where the line rms was calculated using the line free channels. Selected mean spectra averaged over circular regions (10 au in radius) are indicated by the coloured points and the corresponding coloured spectral profiles. The convolved beams are shown in the lower left corner of the map. For clarity, a zoomed-out version of this figure with only the continuum data is presented in Fig. A.1.
Current usage metrics show cumulative count of Article Views (full-text article views including HTML views, PDF and ePub downloads, according to the available data) and Abstracts Views on Vision4Press platform.
Data correspond to usage on the plateform after 2015. The current usage metrics is available 48-96 hours after online publication and is updated daily on week days.
Initial download of the metrics may take a while.