Free Access
Fig. 2
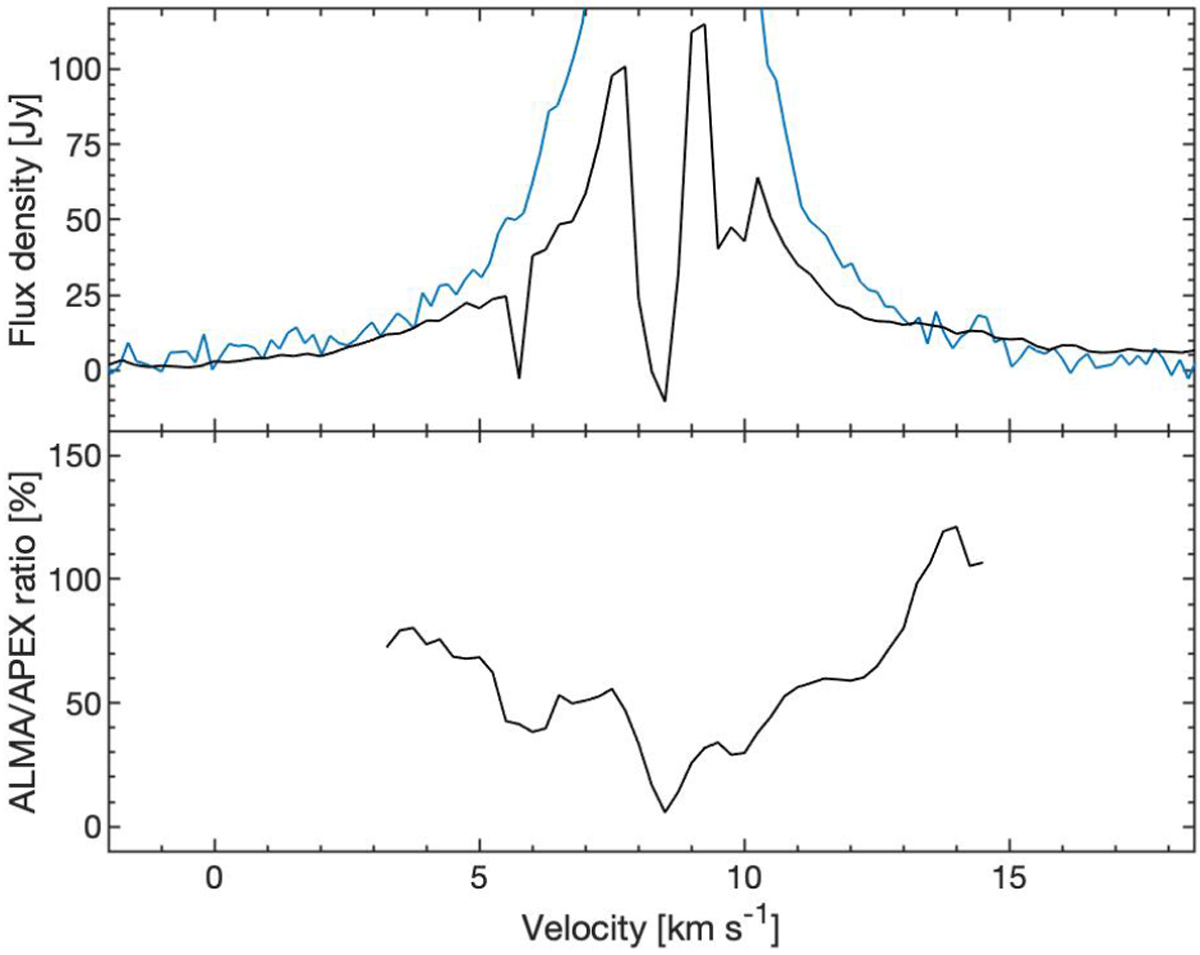
Upper panel: combined multiscale 12CO spectrum (black), integrated over the field of view, as compared to the single-dish APEX spectrum (blue) observed towards the position of B335. Lower panel: moving average (using 1.0 km s−1 bins) of the ALMA-to-APEX ratio of fluxes in regions where the APEX S/N >3σ.
Current usage metrics show cumulative count of Article Views (full-text article views including HTML views, PDF and ePub downloads, according to the available data) and Abstracts Views on Vision4Press platform.
Data correspond to usage on the plateform after 2015. The current usage metrics is available 48-96 hours after online publication and is updated daily on week days.
Initial download of the metrics may take a while.