Fig. 7.
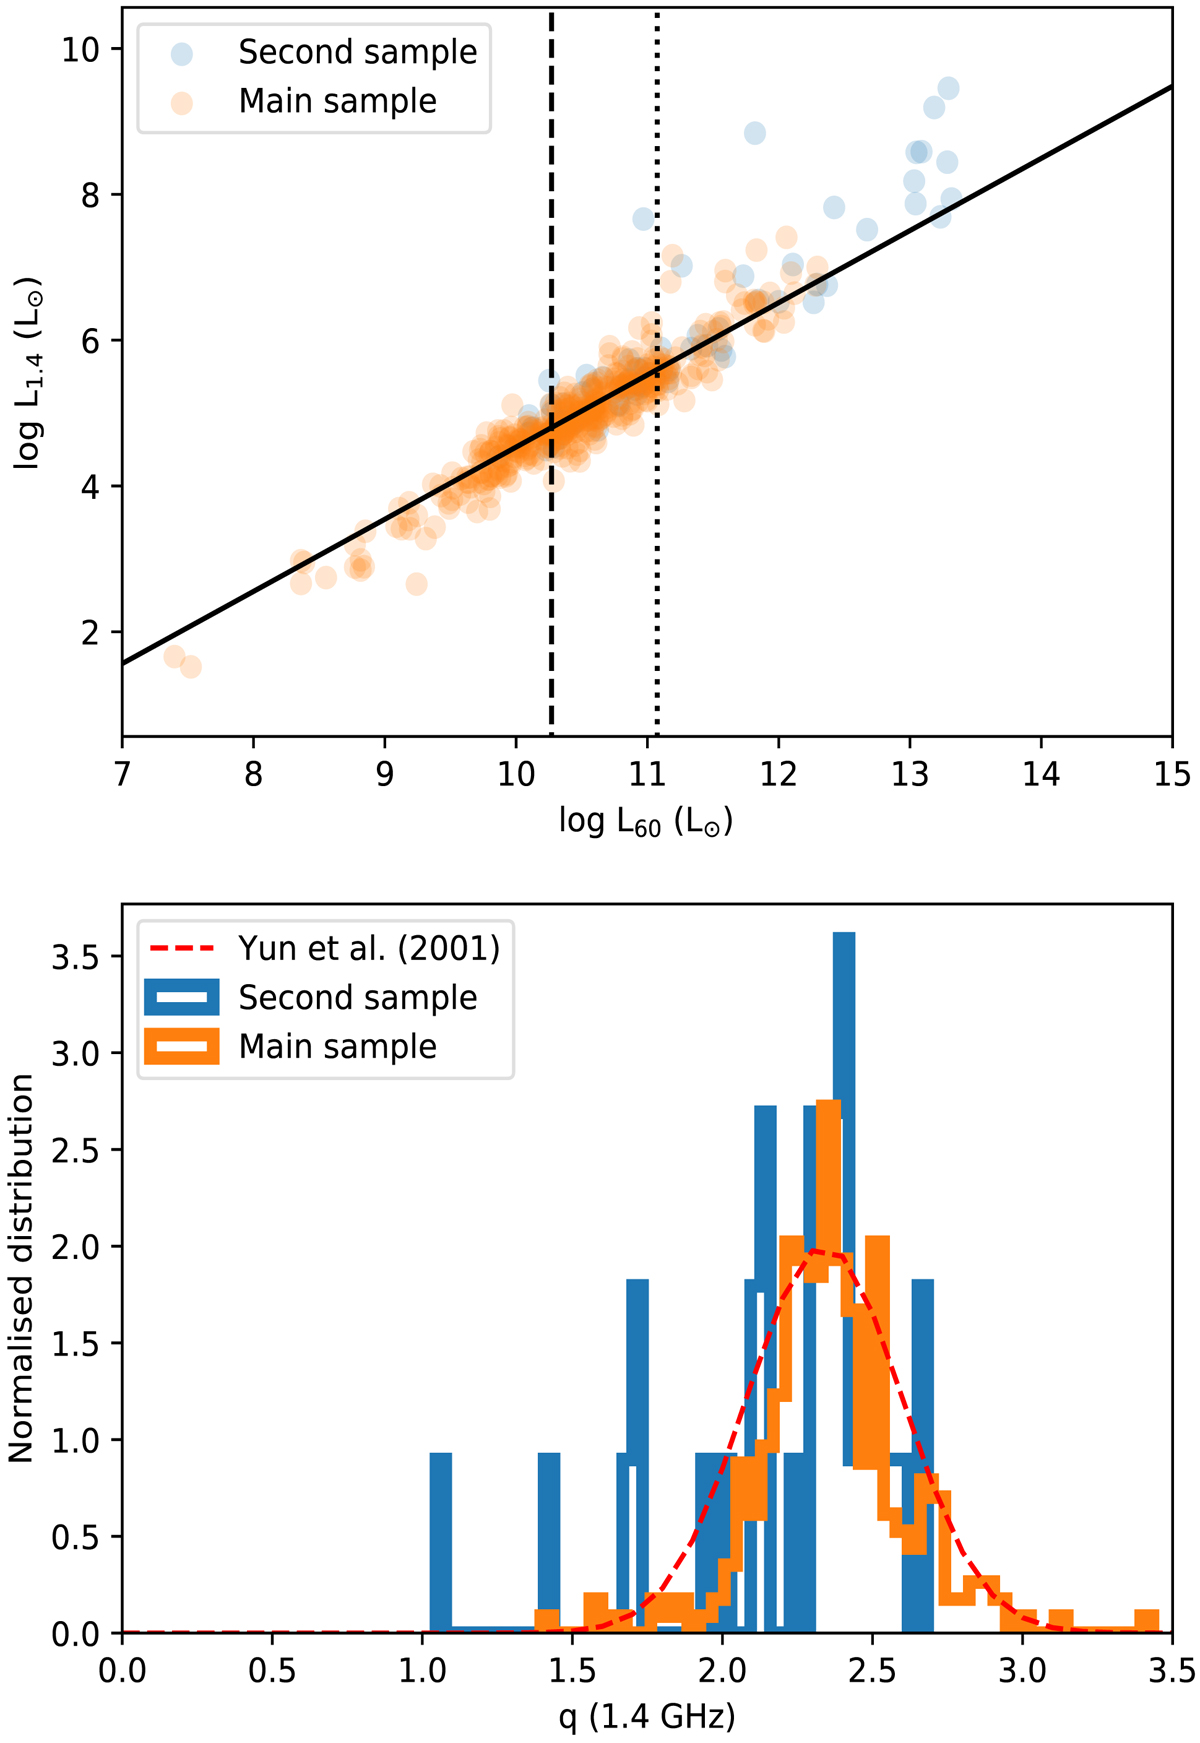
Top: 1.4 GHz radio luminosity plotted against the IRAS 60 μm luminosity. The vertical dashed line indicates the 90% completeness limit at the median redshift of the main sample. The vertical dotted line indicates the 90% completeness limit of the second sample. The solid line is the Yun et al. (2001) relation. Bottom: histogram of q (1.4 GHz) values, derived using Eq. (8), using only sources with NQ > 1 at 100 μm. The dashed line is a Gaussian distribution with mean and standard deviation set to 2.34 and 0.26 respectively, which are values found by Yun et al. (2001).
Current usage metrics show cumulative count of Article Views (full-text article views including HTML views, PDF and ePub downloads, according to the available data) and Abstracts Views on Vision4Press platform.
Data correspond to usage on the plateform after 2015. The current usage metrics is available 48-96 hours after online publication and is updated daily on week days.
Initial download of the metrics may take a while.