Fig. 3.
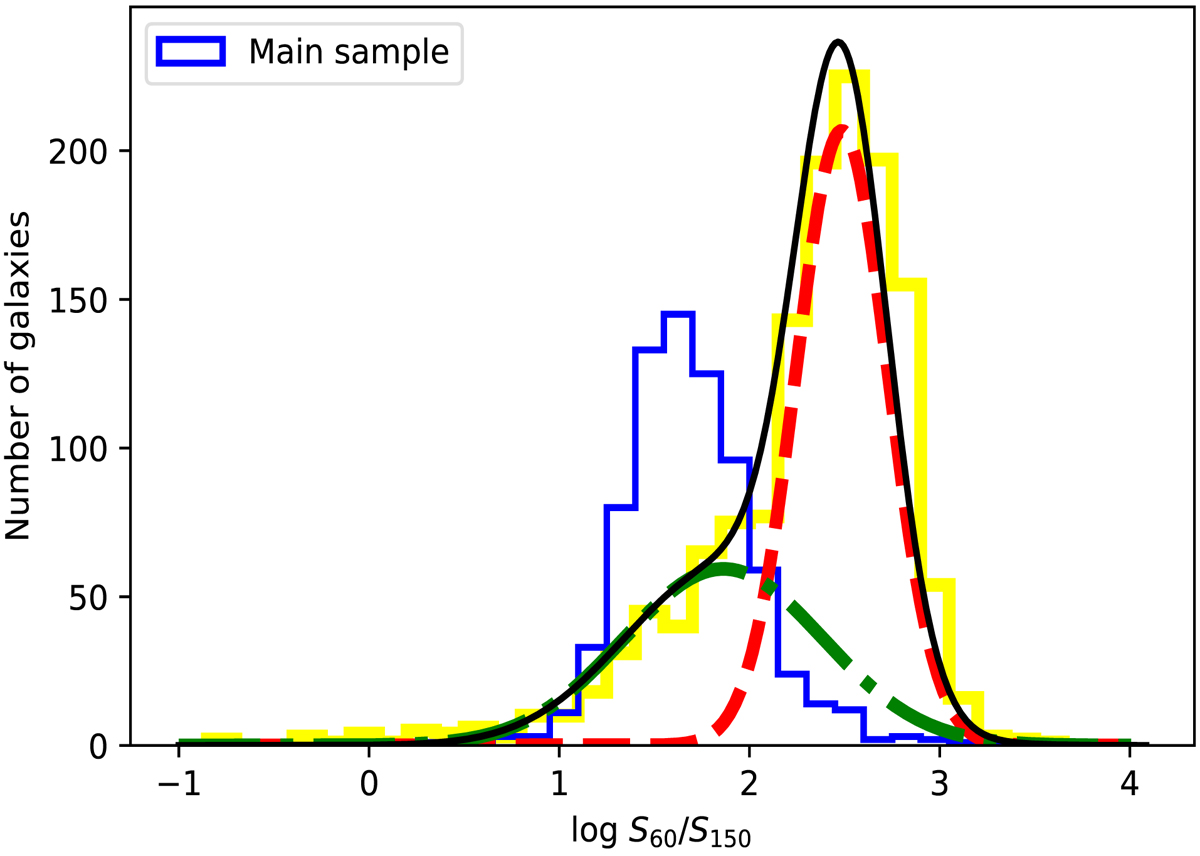
60 μm−150 MHz colour distribution of all matches within 3′ between the RIFSCz sources (which only have IRAS observations) and LOFAR sources (yellow histogram). The dot-dashed Gaussian represents the inferred colour distribution of the true counterparts and the dashed Gaussian represents that of the random associations. The black solid line is the sum of the two. The colour distribution of the main sample is shown as the blue histogram.
Current usage metrics show cumulative count of Article Views (full-text article views including HTML views, PDF and ePub downloads, according to the available data) and Abstracts Views on Vision4Press platform.
Data correspond to usage on the plateform after 2015. The current usage metrics is available 48-96 hours after online publication and is updated daily on week days.
Initial download of the metrics may take a while.