Fig. 13.
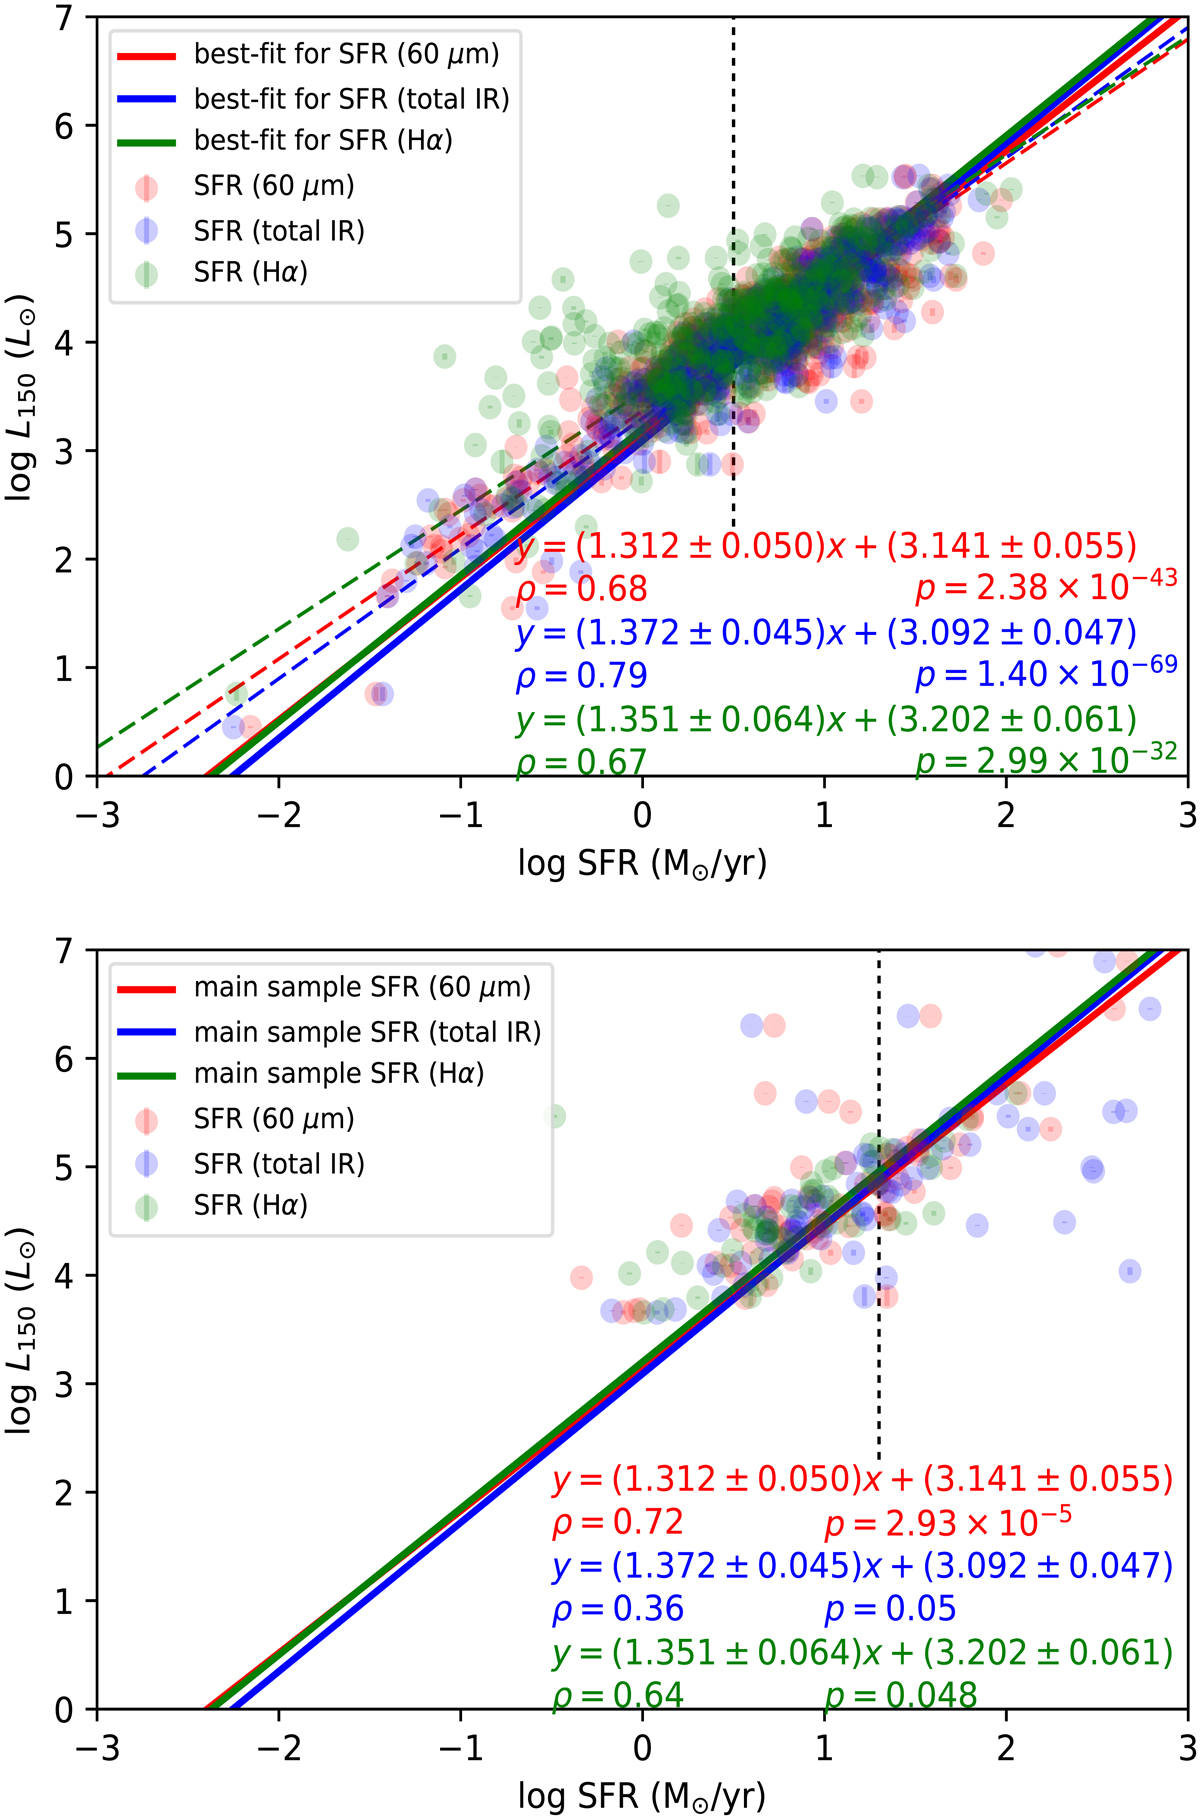
Top: correlation between the rest-frame 150 MHz luminosity and various SFR tracers for the main sample, after excluding AGNs. The vertical dashed line indicates the 90% completeness limit at the median redshift (z ∼ 0.05) of the main sample. The solid lines are best-fit relations derived using only galaxies above the completeness limit. The dashed lines are best-fit relations derived using all galaxies. Bottom: same as top panel but for the second sample. The vertical dashed line indicates the 90% completeness limit at the median redshift (z ∼ 0.12) of the second sample.
Current usage metrics show cumulative count of Article Views (full-text article views including HTML views, PDF and ePub downloads, according to the available data) and Abstracts Views on Vision4Press platform.
Data correspond to usage on the plateform after 2015. The current usage metrics is available 48-96 hours after online publication and is updated daily on week days.
Initial download of the metrics may take a while.