Fig. 9
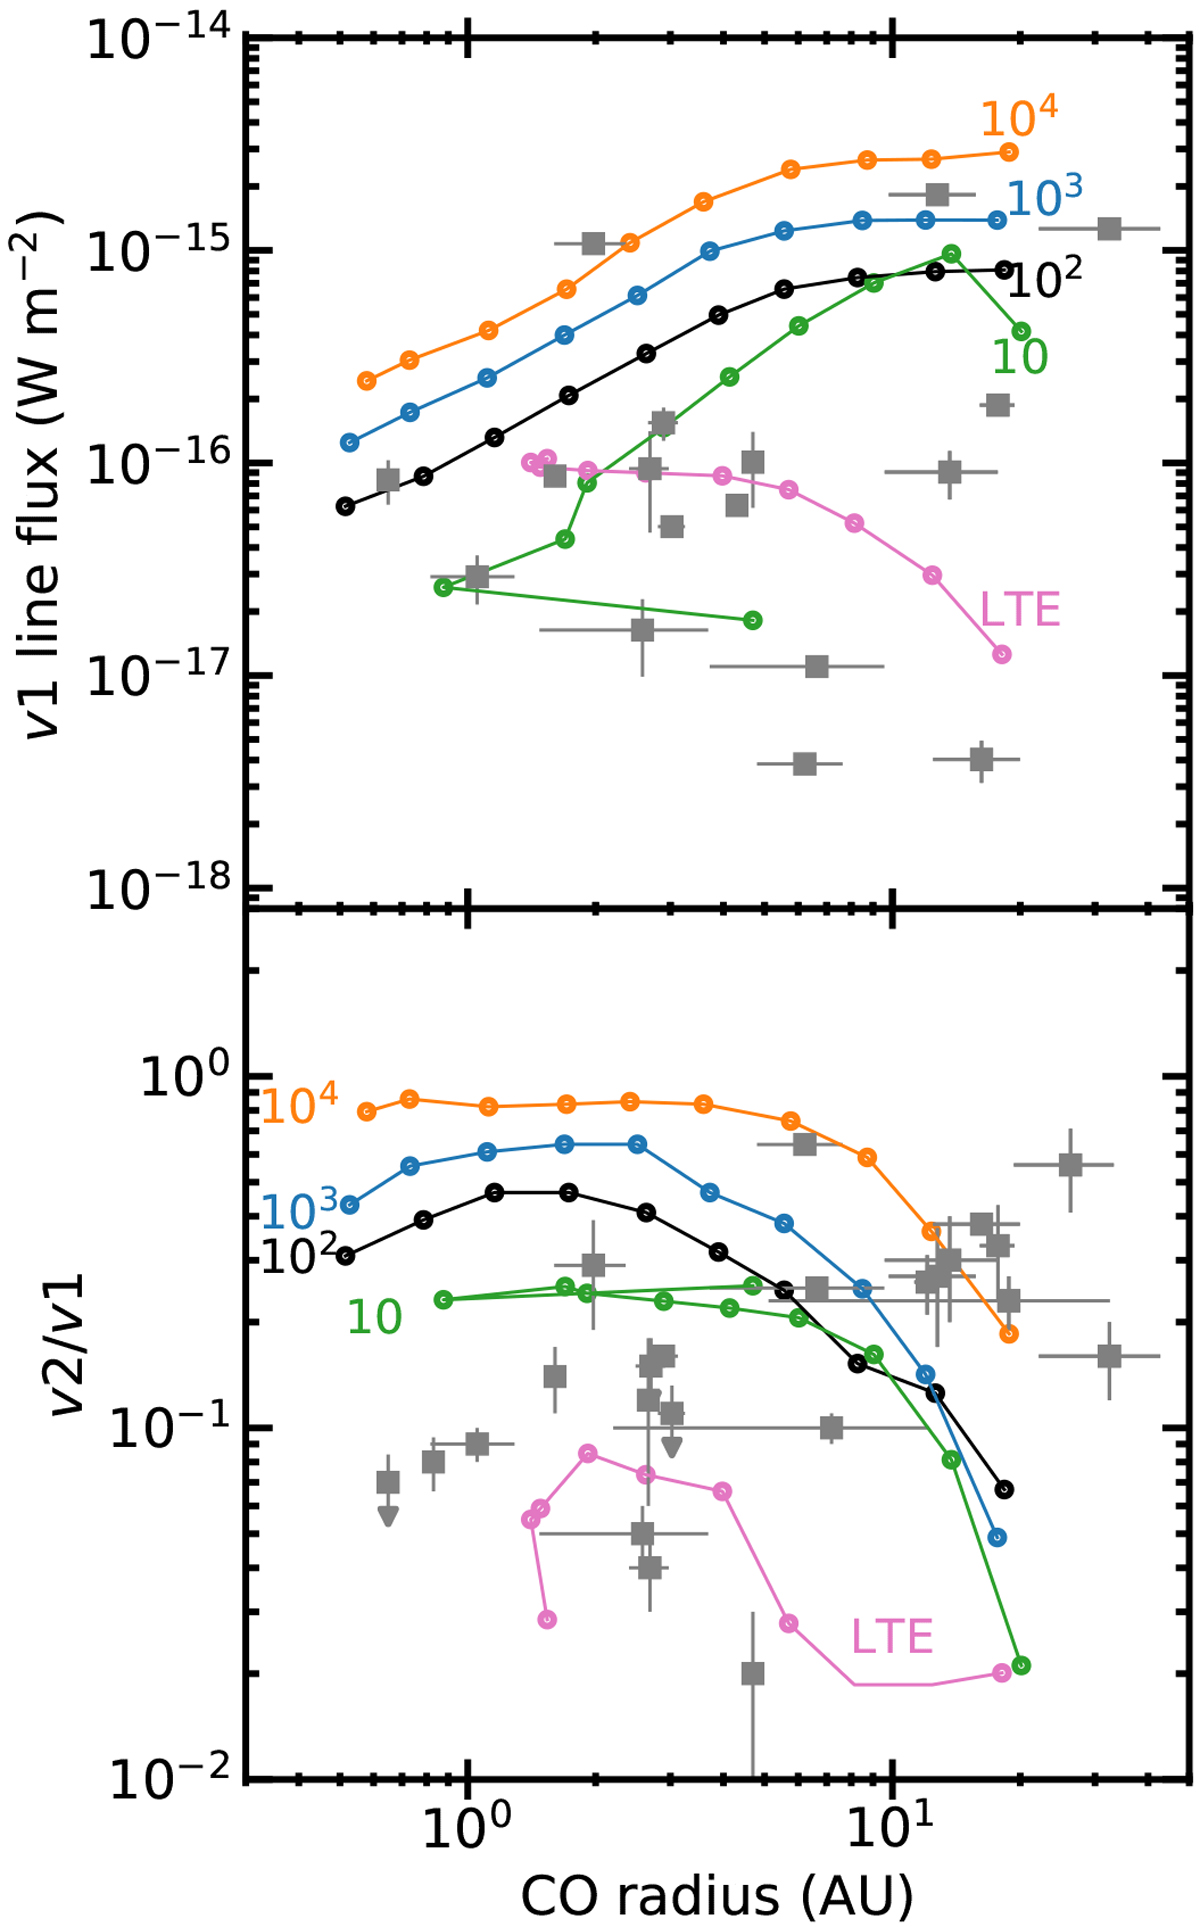
v1 line flux (top) and vibrational ratio of CO (bottom) versus the inferred radius of emission for observational data and DALI model results. Lines connect the dots in order of inner model radius. Labels indicate the gas-to-dust ratio for the thermo-chemical models, the LTE model also has a gas-to-dust ratio of 100. The model with the largest cavity has the largest CO radius. The dust surface density is kept constant for models of different gas-to-dust ratios. Due to missing data, not every source with a vibrational ratio in the lower panel also has a line flux in the upper panel. Clearly none of these models reproduce the trends in the data.
Current usage metrics show cumulative count of Article Views (full-text article views including HTML views, PDF and ePub downloads, according to the available data) and Abstracts Views on Vision4Press platform.
Data correspond to usage on the plateform after 2015. The current usage metrics is available 48-96 hours after online publication and is updated daily on week days.
Initial download of the metrics may take a while.