Fig. 5
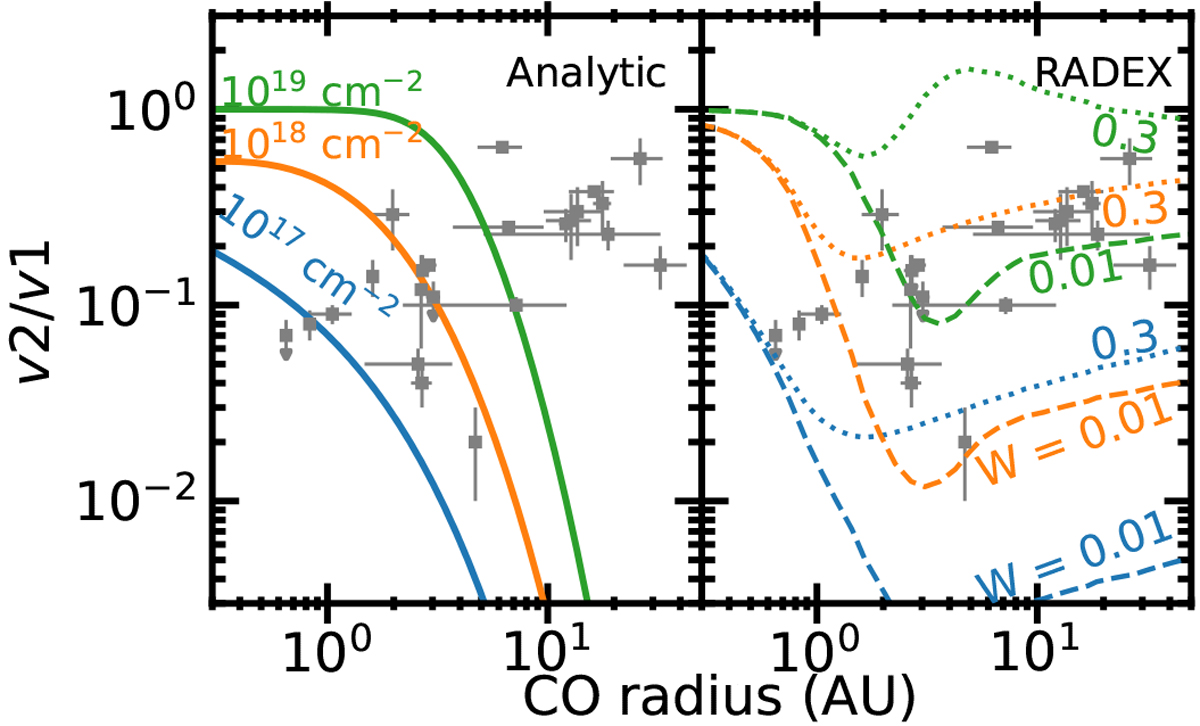
CO vibrational ratio versus the inferred radius of emission for observational data (gray points) and analytic (left) and RADEX (right) model results (colored lines). For the RADEX models, two different assumption for the radiation field are shown weakly irradiated (W = 0.01, dashed) and strongly irradiated (W = 0.3, dotted) cases. For the highest column onlythe LTE model and the weakly irradiated RADEX model are shown. The density for the RADEX models is 1012 cm−3.
Current usage metrics show cumulative count of Article Views (full-text article views including HTML views, PDF and ePub downloads, according to the available data) and Abstracts Views on Vision4Press platform.
Data correspond to usage on the plateform after 2015. The current usage metrics is available 48-96 hours after online publication and is updated daily on week days.
Initial download of the metrics may take a while.