Fig. 4
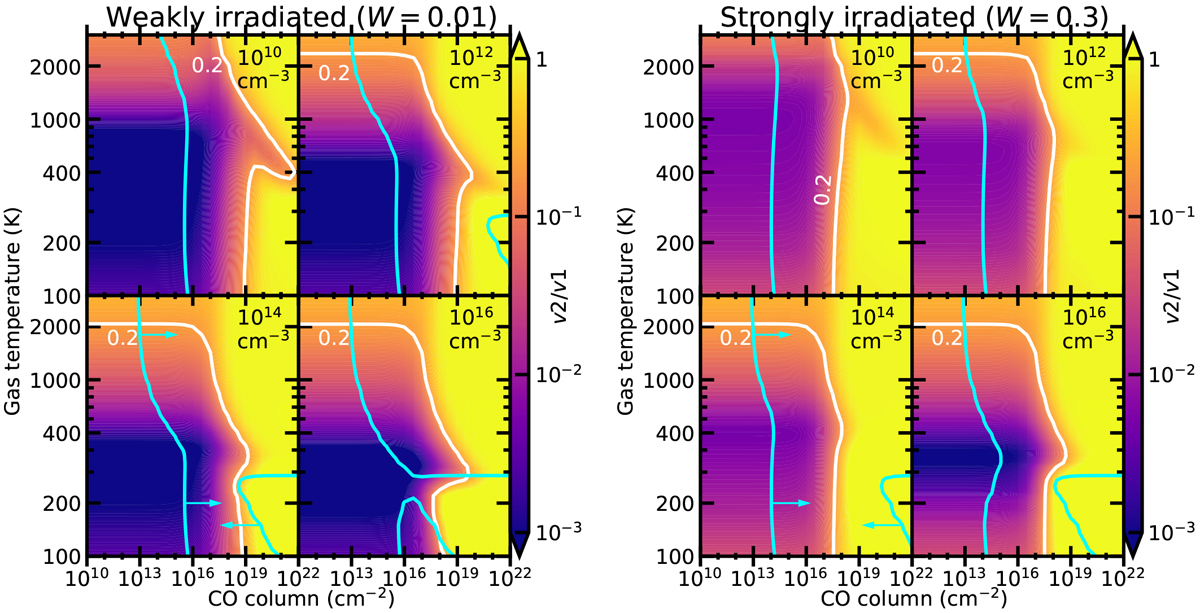
CO vibrational ratio, v2∕v1, for differenttemperatures and columns from the RADEX models using a 750 K radiation field with a dilution factor W of 0.01 (left) and 0.3 (right). The area between the blue and white lines shows where both the vibrational ratio and the v1 flux of the low vibrational ratio sources are reproduced. For the v1 flux an emitting area with a radius of 5 AU is assumed. If a smaller emitting area is assumed the blue lines would shift in the direction of the blue arrows. High vibrational ratio sources can either be explained by gas with a high column (N ≳ 1018 cm−2) or a high temperature (T > 2000 K).
Current usage metrics show cumulative count of Article Views (full-text article views including HTML views, PDF and ePub downloads, according to the available data) and Abstracts Views on Vision4Press platform.
Data correspond to usage on the plateform after 2015. The current usage metrics is available 48-96 hours after online publication and is updated daily on week days.
Initial download of the metrics may take a while.