Free Access
Fig. 3
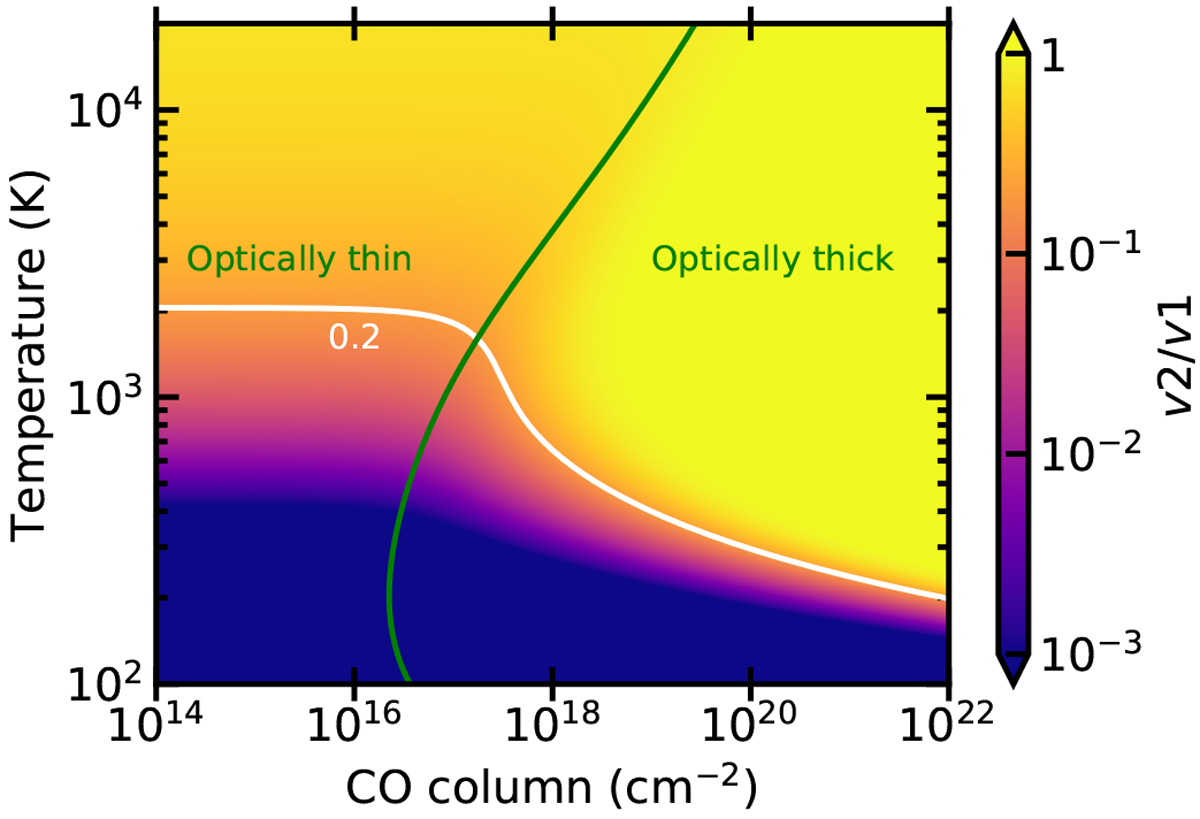
CO vibrational ratio, v2∕v1, for different temperatures and columns from the analytic model. The green line shows the τ = 1 conditions for the v1 line. The white line shows v2∕v1 = 0.2, which is the value that differentiates low and high vibrational ratio sources.
Current usage metrics show cumulative count of Article Views (full-text article views including HTML views, PDF and ePub downloads, according to the available data) and Abstracts Views on Vision4Press platform.
Data correspond to usage on the plateform after 2015. The current usage metrics is available 48-96 hours after online publication and is updated daily on week days.
Initial download of the metrics may take a while.