Free Access
Fig. F.1
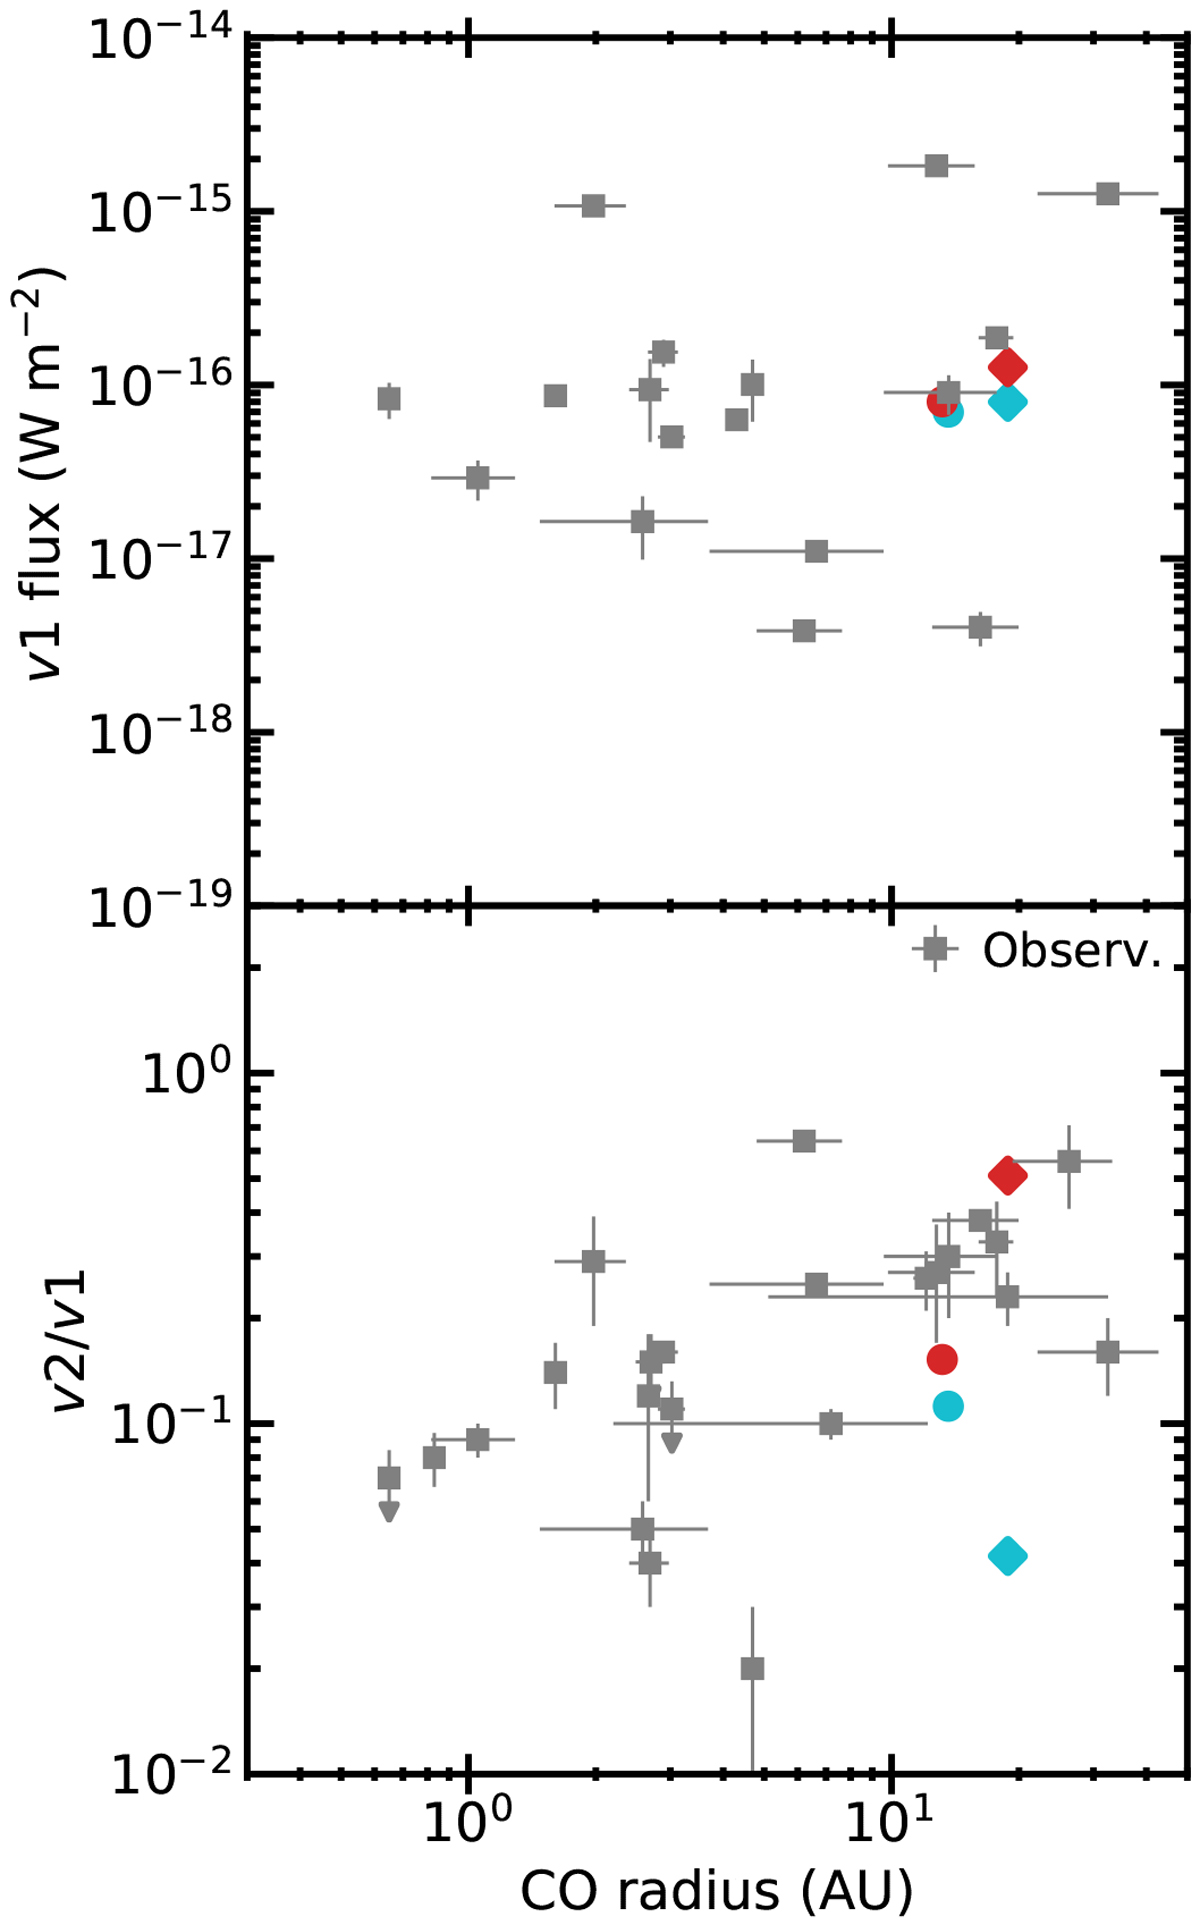
v1 line flux (top) and vibrational ratio of CO (bottom) versus the inferred radius of emission for observational data and DALI model results. Cyan and red markers show models with agas-to-dust ratio of 20 000 and 100 000 respectively. Circles show models with Rin = 10 AU, squares show models with with Rin = 15 AU.
Current usage metrics show cumulative count of Article Views (full-text article views including HTML views, PDF and ePub downloads, according to the available data) and Abstracts Views on Vision4Press platform.
Data correspond to usage on the plateform after 2015. The current usage metrics is available 48-96 hours after online publication and is updated daily on week days.
Initial download of the metrics may take a while.