Fig. C.1
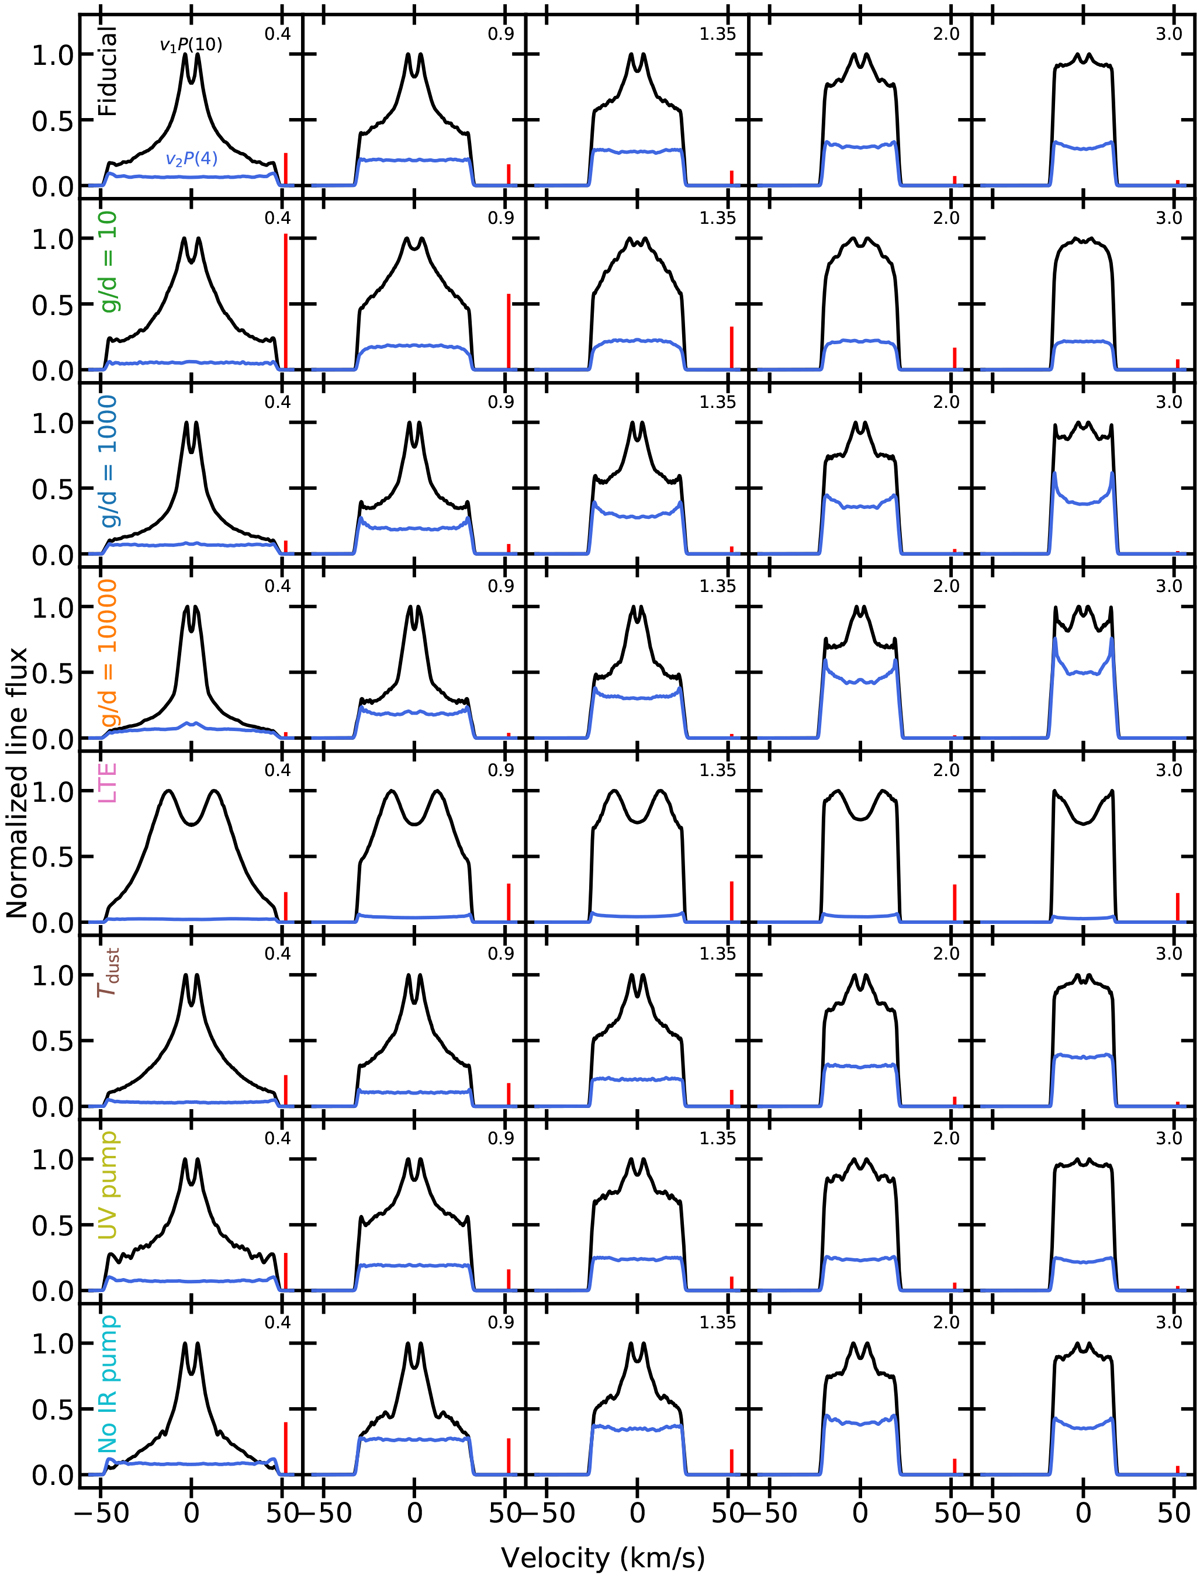
Normalized model line profiles for the v1 (black) and the v2 (blue) lines for a subset of the models at the native resolution of the model, R = 106. The text on the left of each panel denotes the model set. The top right corner of each panel denotes the inner radius of the model. The vertical bar in the bottom right of each panel shows 0.03 of the continuum flux density. All lines are modelled assuming a 45 degree inclination. No noise has been added to these lines, features in the line profiles are due to the sampling of the DALI grid.
Current usage metrics show cumulative count of Article Views (full-text article views including HTML views, PDF and ePub downloads, according to the available data) and Abstracts Views on Vision4Press platform.
Data correspond to usage on the plateform after 2015. The current usage metrics is available 48-96 hours after online publication and is updated daily on week days.
Initial download of the metrics may take a while.