Fig. B.1
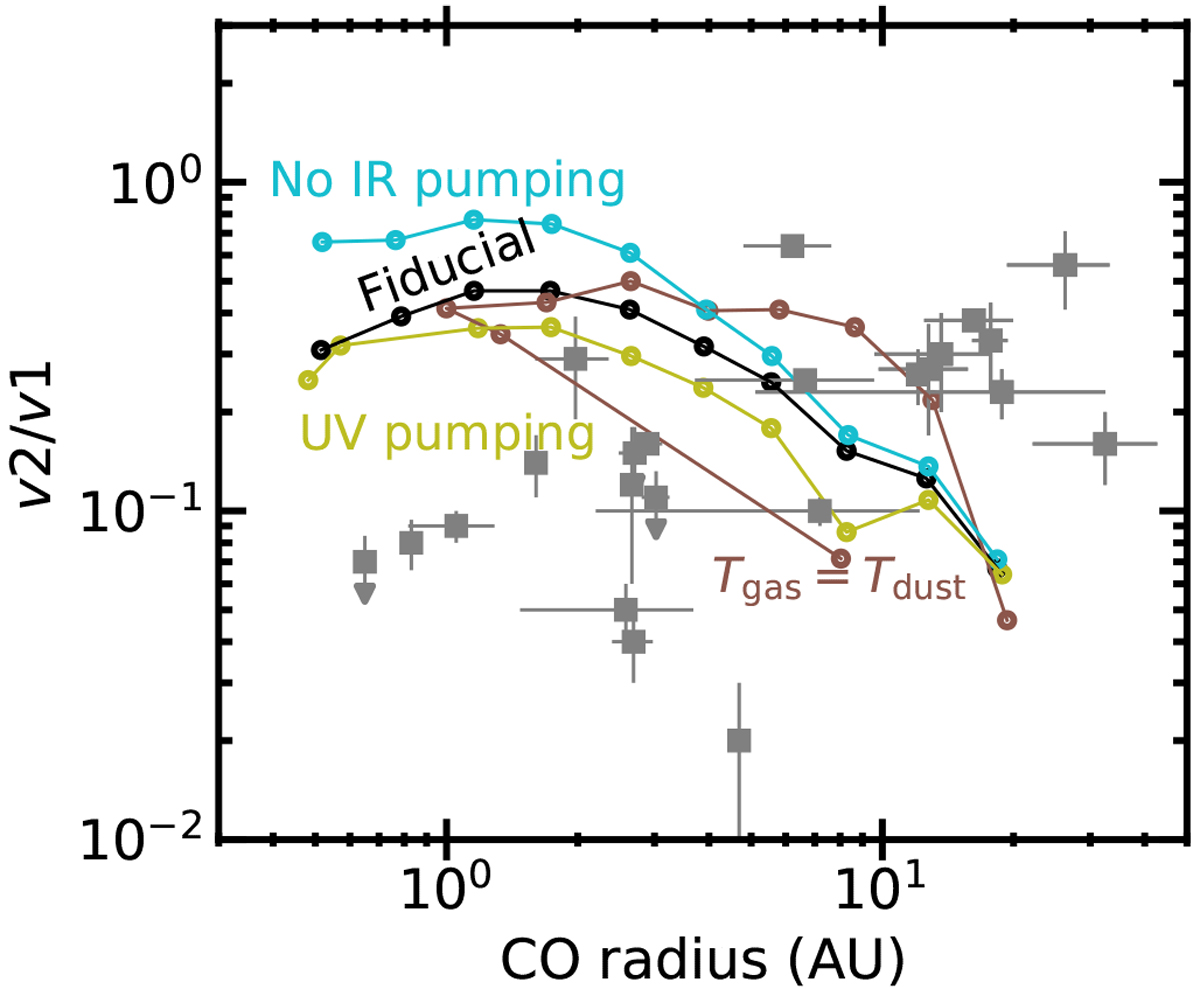
Ratio of the flux from the v = 2 and v = 1 levels of COversus the inferred radius of emission for observational data and DALI model results. Line connect the dots in order of inner model radius. Labels indicate the different assumptions for the excitation calculation. All models have a gas-to-dust ratio of 100. The model with the largest cavity is always at the largest CO radius. Different assumptions on the excitation are tested.
Current usage metrics show cumulative count of Article Views (full-text article views including HTML views, PDF and ePub downloads, according to the available data) and Abstracts Views on Vision4Press platform.
Data correspond to usage on the plateform after 2015. The current usage metrics is available 48-96 hours after online publication and is updated daily on week days.
Initial download of the metrics may take a while.