Fig. 16
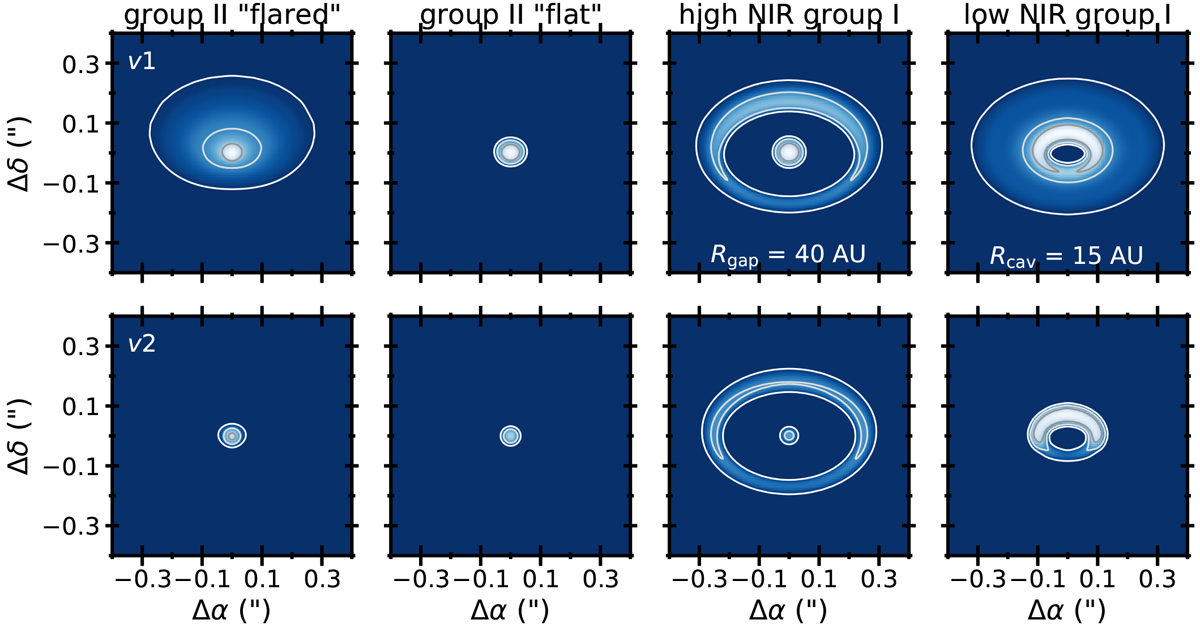
Simulated velocity integrated v1P(10) (top) and v2P(4) (bottom) line maps convolved to METIS resolution (Brandl et al. 2014). The color scale is log-stretched between 0.1 and 100% of the maximum of the v1 line flux. The continuum has been subtracted before velocity integration. The contours show 0.1, 1 and 10% of the peak surface brightness. The disk geometries refer to those presented in Fig. 13. The distance is assumed to be 150 parsec and the inclination is 45 degrees, the far side of the disk is in the north. For the “flat” geometry, a truncated gas disk (5 AU outer radius) is used. The high NIR group I image is composed by combining two models, a truncated disk model, with an inclination of 30 degrees and a disk with a 40 AU hole and a strong dust trap (so strong v2 emission) with an inclination of 45 degrees. No interactions between the inner and outer disk have been taken into account.
Current usage metrics show cumulative count of Article Views (full-text article views including HTML views, PDF and ePub downloads, according to the available data) and Abstracts Views on Vision4Press platform.
Data correspond to usage on the plateform after 2015. The current usage metrics is available 48-96 hours after online publication and is updated daily on week days.
Initial download of the metrics may take a while.