Fig. 15
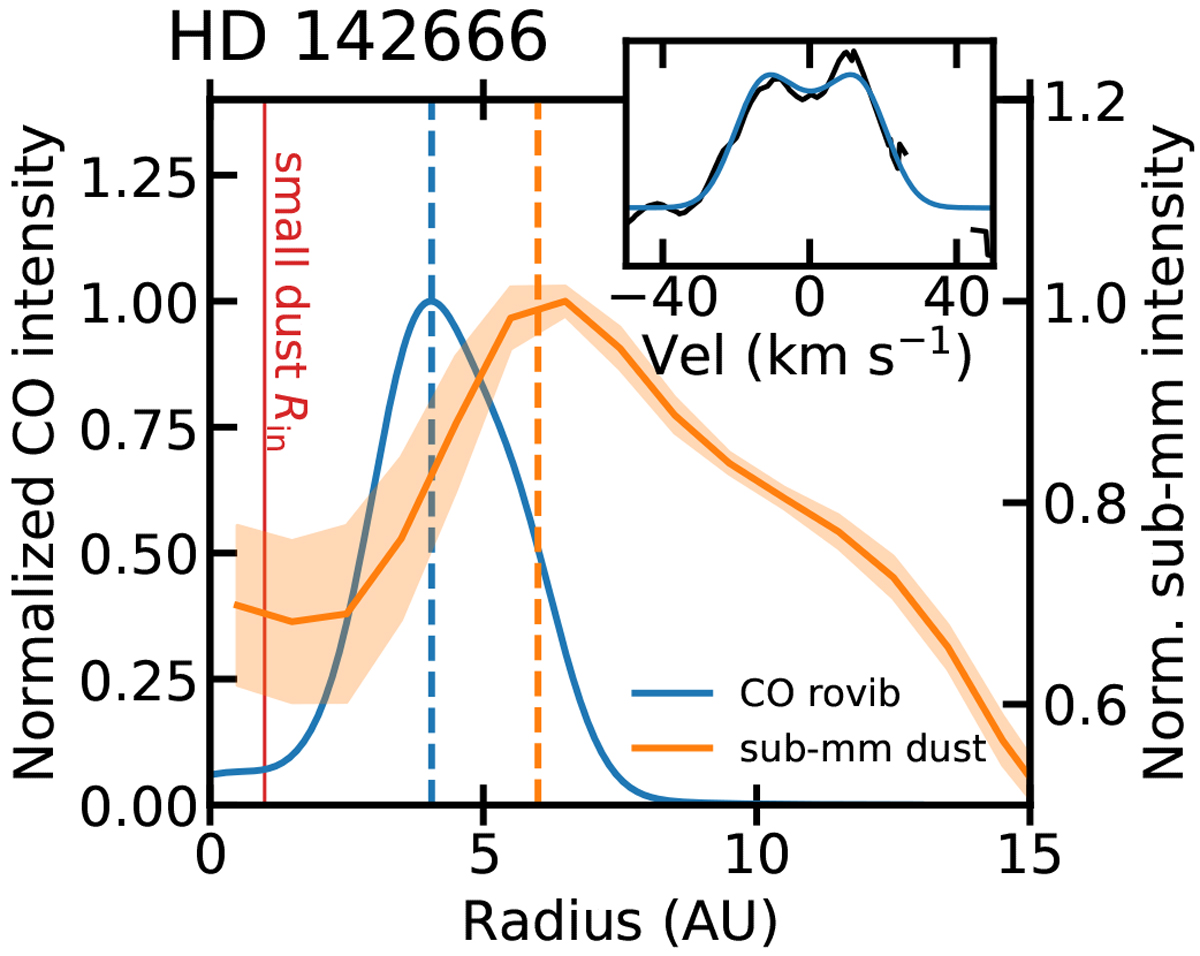
Radial intensity cuts for the sub-millimeter dust from Huang et al. (2018) and the radial intensity as inferred from the CO rovibrational line profile of HD 142666. Vertical dashed lines show the maximum of the CO and sub-millimeter dust intensity. The CO emission is clearly contained within the bright sub-millimeter ring at 6 AU. The inset on the top right shows the observed line profile (black) and the fit profile (blue). The vertical red line shows the inner edge of the dust disk at ~ 1 AU as inferred from IR interferometry (Schegerer et al. 2013).
Current usage metrics show cumulative count of Article Views (full-text article views including HTML views, PDF and ePub downloads, according to the available data) and Abstracts Views on Vision4Press platform.
Data correspond to usage on the plateform after 2015. The current usage metrics is available 48-96 hours after online publication and is updated daily on week days.
Initial download of the metrics may take a while.