Fig. 14
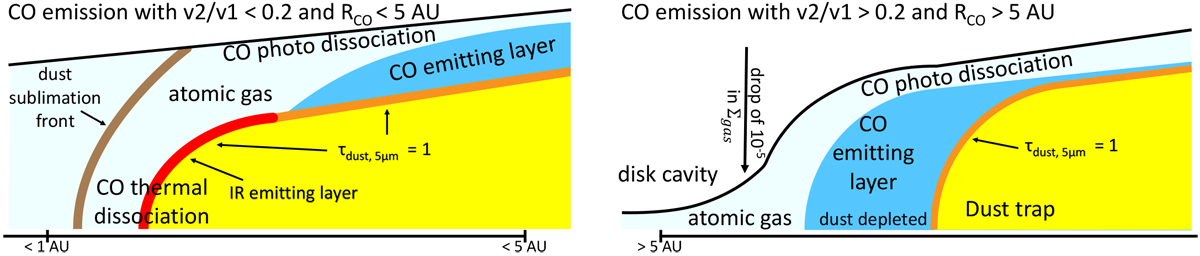
Sketches of the upper right quartile of a disk cross section of the preferred configuration of the CO emitting region in the case of low RCO and low v2∕v1 (group II and group I high NIR, left) and large RCO and high v2∕v1 (group I low NIR, right). This figure is an update to Fig. 7 including the DALI results. Relevant radial scales for the inner and outer edge are shown on the bottom left and right corner of each sketch.
Current usage metrics show cumulative count of Article Views (full-text article views including HTML views, PDF and ePub downloads, according to the available data) and Abstracts Views on Vision4Press platform.
Data correspond to usage on the plateform after 2015. The current usage metrics is available 48-96 hours after online publication and is updated daily on week days.
Initial download of the metrics may take a while.