Fig. 13
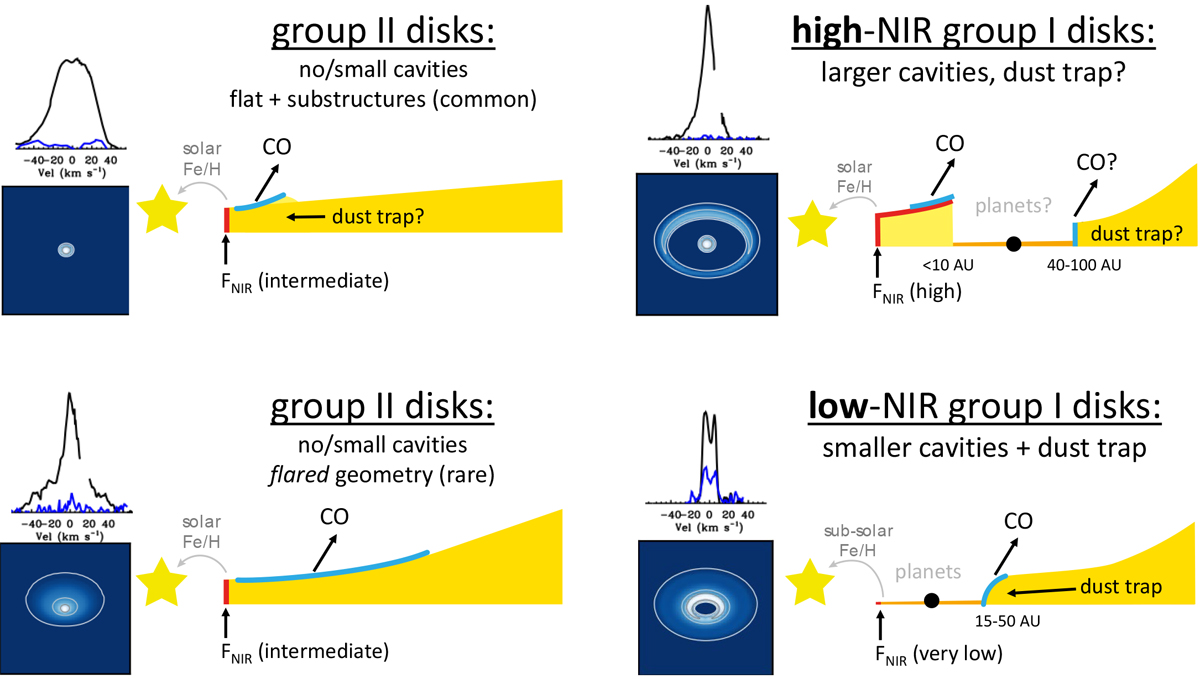
Typical line profiles, simulated images and inferred disk proposed disk structures for four types of disks identified in the Herbig sample. Near-infrared continuum and CO emitting areas are shown in red and blue respectively. The simulated images show the velocity integrated CO v1 line flux. These images are discussed in more detail in Sect. 5.4. The disk structures are updated versions of those shown in Fig. 1.
Current usage metrics show cumulative count of Article Views (full-text article views including HTML views, PDF and ePub downloads, according to the available data) and Abstracts Views on Vision4Press platform.
Data correspond to usage on the plateform after 2015. The current usage metrics is available 48-96 hours after online publication and is updated daily on week days.
Initial download of the metrics may take a while.