Fig. 12
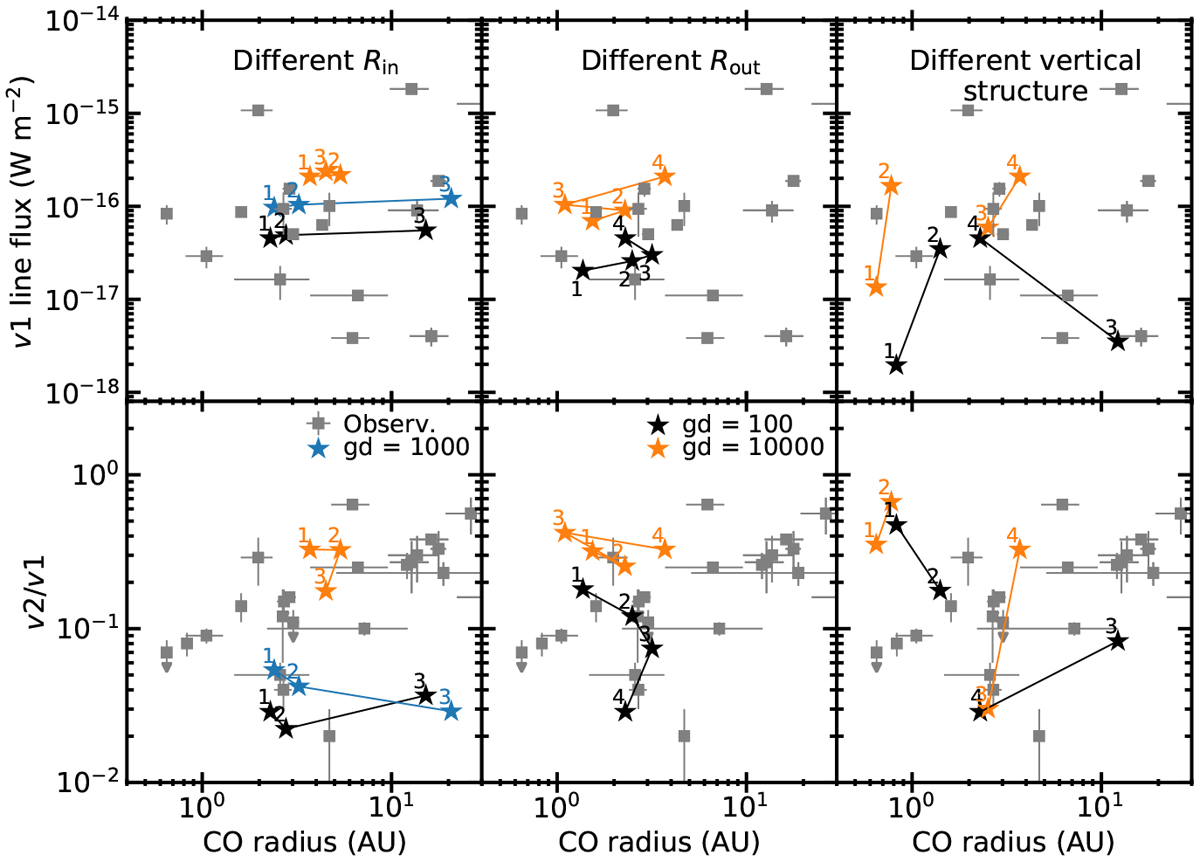
v1 flux (top) and CO vibrational ratio (bottom) versus the inferred radius of emission for observational data and model results. The contribution from the inner edge has been subtracted from the models spectra before analysis. Models show variation in inner radius (left panel), variation in outer radius (middle panel) and variation in flaring and disk height (right panel). In the left and middle panels lines connect points in increasing order of the parameter varied. In the right panels, lines connect models with the same flaring angle and thus the difference between connected points show the effect of a change in thickness of the disk. Table 3 lists the parameters varied for these models. Models with a gas-to-dust ratio of 100 and 1000 are better at reproducing the vibrational ratio than the models with gas-to-dust ratios of 10 000. Variation in the vibrational ratio can be reproduced by variations in the disk structure, but no single parameter explain all the variation.
Current usage metrics show cumulative count of Article Views (full-text article views including HTML views, PDF and ePub downloads, according to the available data) and Abstracts Views on Vision4Press platform.
Data correspond to usage on the plateform after 2015. The current usage metrics is available 48-96 hours after online publication and is updated daily on week days.
Initial download of the metrics may take a while.