Fig. 6.
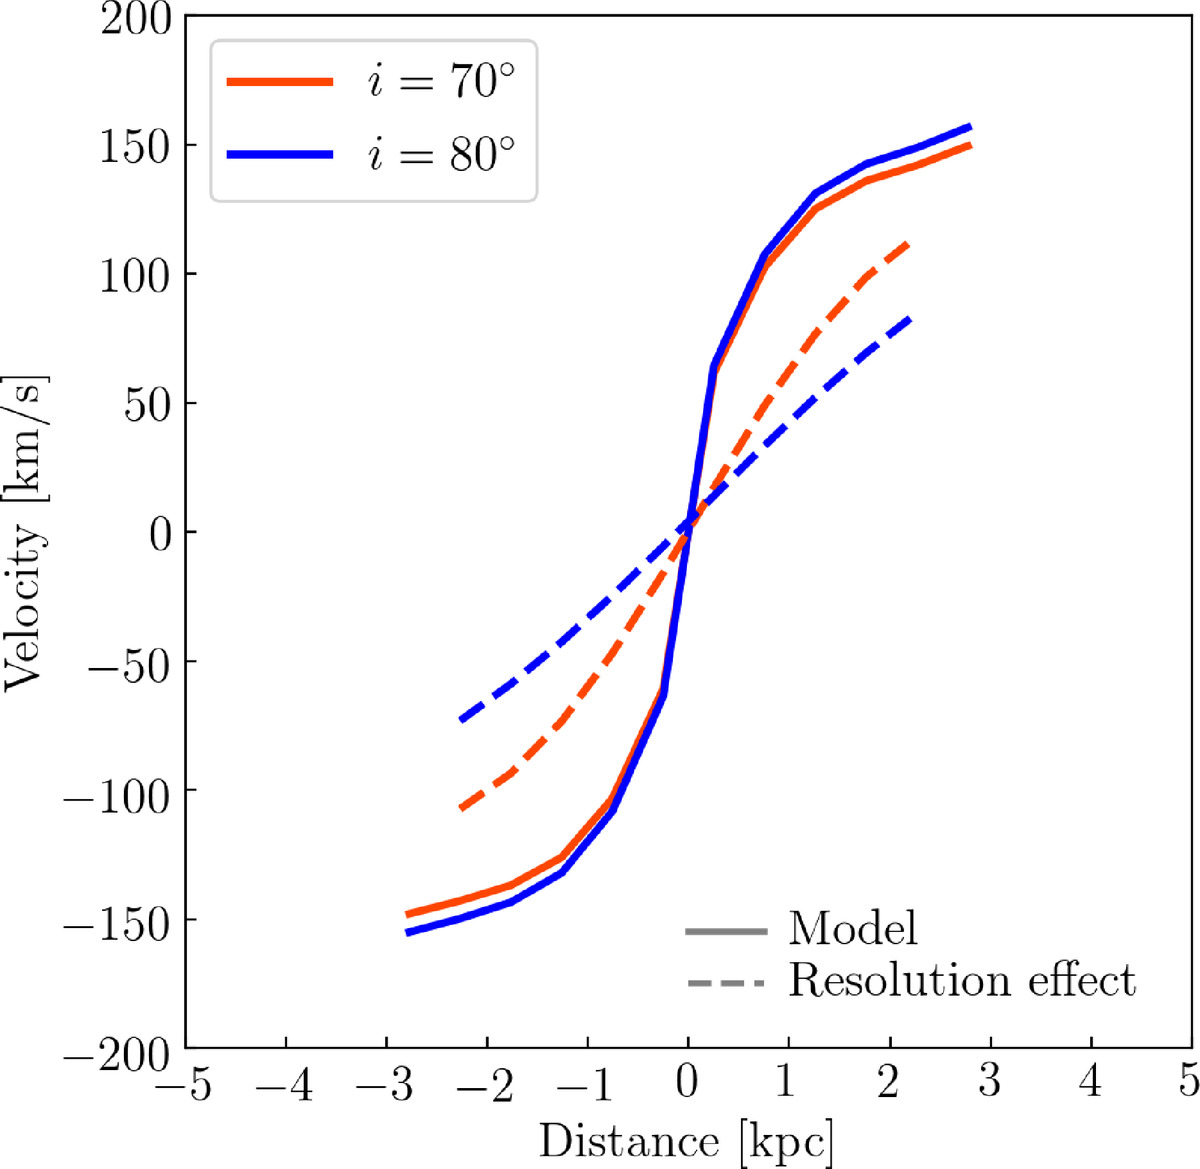
Effect of the inclination on the rotation curve due to the spatial resolution. The solid curves represent the rotation curves that were simulated using the same parameters as in Fig. 5, with Rgas = 1 kpc and Hgas = 1 kpc for an inclination of i = 70° (orange) and i = 80° (blue). The dashed lines present the two models smoothed to the spatial resolution determined by Eq. (2) with their corresponding inclinations and Hgas = 1 kpc.
Current usage metrics show cumulative count of Article Views (full-text article views including HTML views, PDF and ePub downloads, according to the available data) and Abstracts Views on Vision4Press platform.
Data correspond to usage on the plateform after 2015. The current usage metrics is available 48-96 hours after online publication and is updated daily on week days.
Initial download of the metrics may take a while.