Open Access
Fig. 11
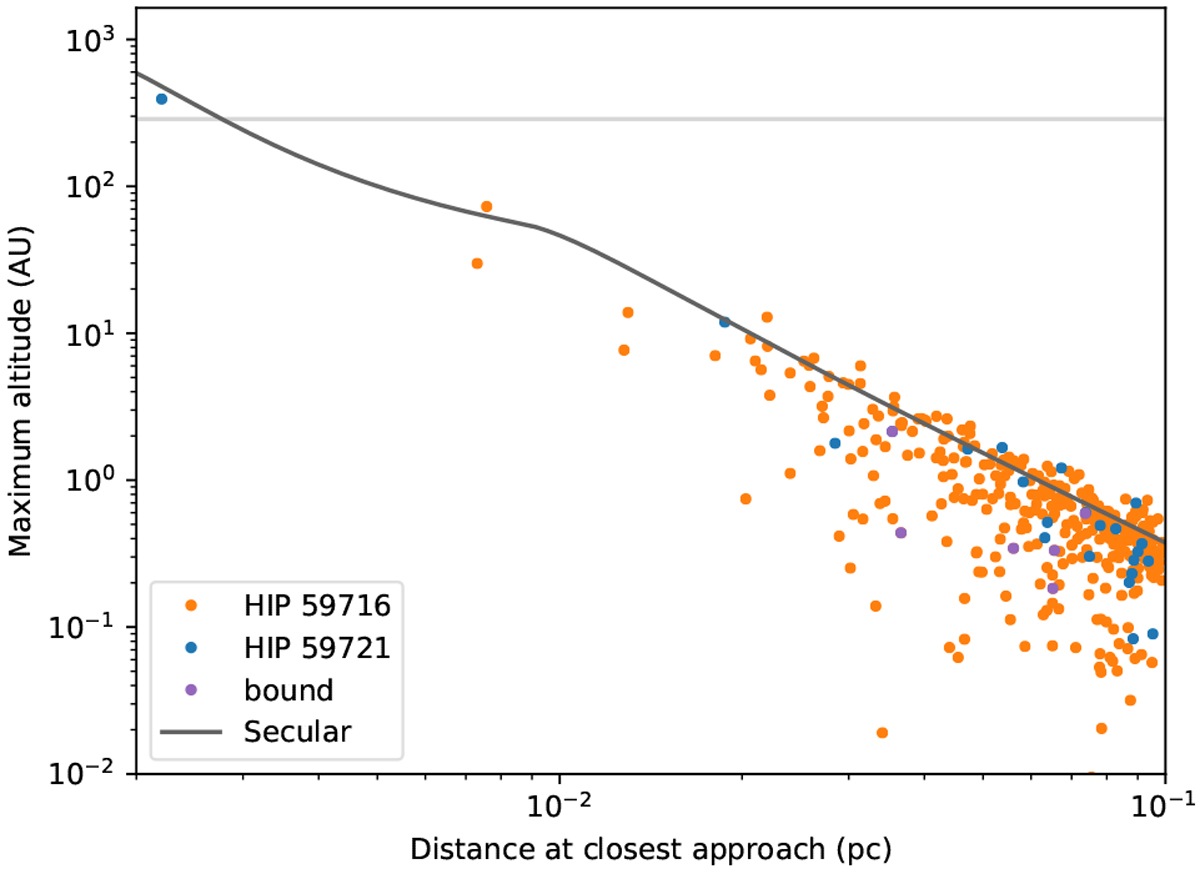
Maximal altitude with respect to the distance at closest approach, from N-body simulations (dots) and secular theoretical approach (line), for the closer fly-bys, and for an initial planetary apoastron of 1000 au. The grey line indicates the projected elevation of the planet.
Current usage metrics show cumulative count of Article Views (full-text article views including HTML views, PDF and ePub downloads, according to the available data) and Abstracts Views on Vision4Press platform.
Data correspond to usage on the plateform after 2015. The current usage metrics is available 48-96 hours after online publication and is updated daily on week days.
Initial download of the metrics may take a while.