Fig. 2
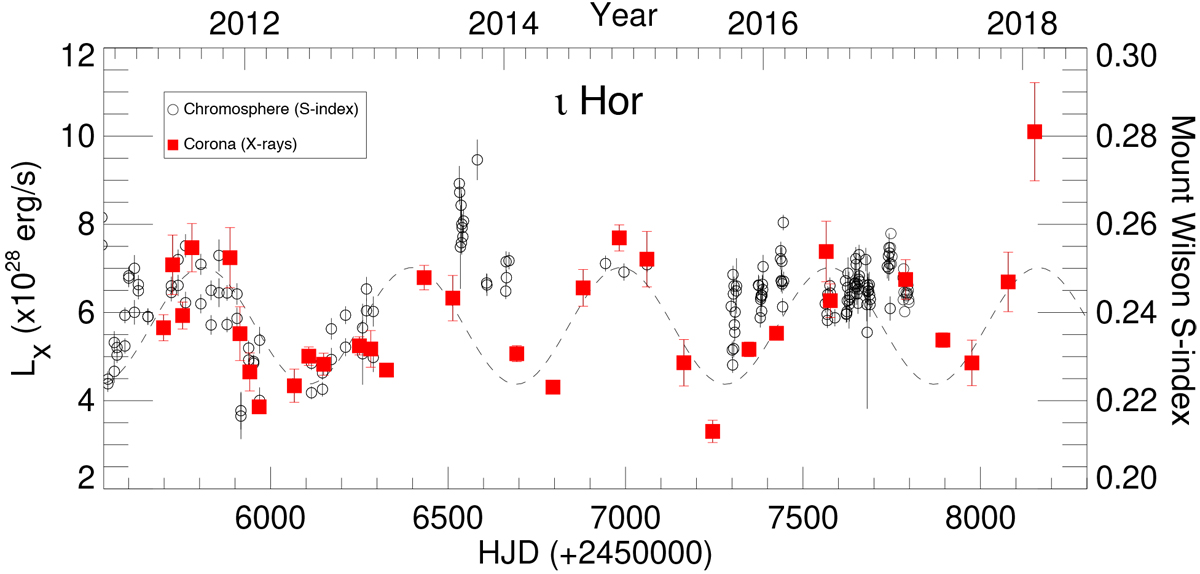
Time series of X-ray luminosity and chromospheric S-index for ι Hor. The dashedline indicates the cycle calculated using just coronal X-ray data (period of 588.5 d). The error bars of coronal X-ray luminosity are based on the standard deviation within each snapshot. Chromospheric data from SSM13 and Alvarado-Gómez et al. (2018b).
Current usage metrics show cumulative count of Article Views (full-text article views including HTML views, PDF and ePub downloads, according to the available data) and Abstracts Views on Vision4Press platform.
Data correspond to usage on the plateform after 2015. The current usage metrics is available 48-96 hours after online publication and is updated daily on week days.
Initial download of the metrics may take a while.