Free Access
Fig. A.3
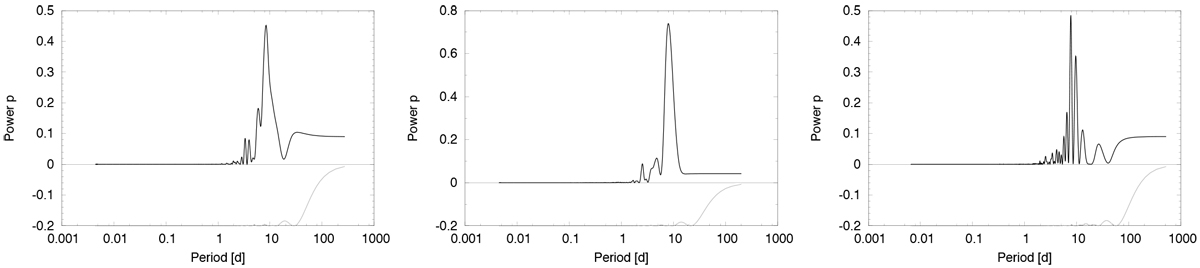
Generalized Lomb–Scargle power spectrum (top panels) and window function (bottom panels) for the TESS light curve of ι Hor in Sector 2 (left), Sector 3 (center), and combined data of sectors 2 and 3 (right). The highest peaks are at a period of Prot =8.43, 7.95, and 9.47 d, respectively.
Current usage metrics show cumulative count of Article Views (full-text article views including HTML views, PDF and ePub downloads, according to the available data) and Abstracts Views on Vision4Press platform.
Data correspond to usage on the plateform after 2015. The current usage metrics is available 48-96 hours after online publication and is updated daily on week days.
Initial download of the metrics may take a while.