Fig. 5.
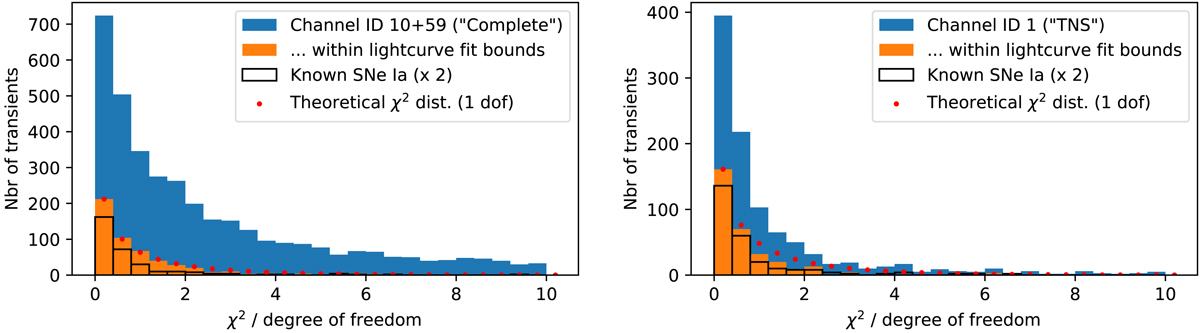
Histogram of SALT2 SN Ia fit quality (chi2 per degree of freedom) for the complete 10 + 59 channel. Blue bars show the full sample (with enough detections for fit) while orange shows the subset which also fulfill the expected fit parameter requirements. These are compared with the fit quality for the subset of known SN Ia in the comparison sample (outlined bars, scaled with a factor 2) as well as a standard χ2 distribution for one degree of freedom (scaled to match the first bin of the restricted sample).
Current usage metrics show cumulative count of Article Views (full-text article views including HTML views, PDF and ePub downloads, according to the available data) and Abstracts Views on Vision4Press platform.
Data correspond to usage on the plateform after 2015. The current usage metrics is available 48-96 hours after online publication and is updated daily on week days.
Initial download of the metrics may take a while.