Fig. 4.
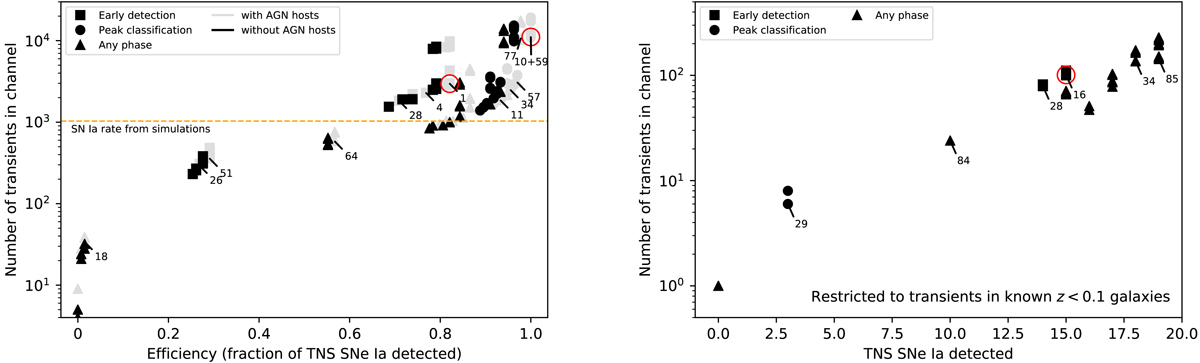
Comparison of the total number of accepted candidates (y-axis) with the fraction of the comparison sample SNe Ia detected (x-axis). Symbol shapes indicate the typical phase at which objects in the comparison sample were detected: channels where more than 25% were detected prior to phase −10 are marked as early (squares). If instead more than 95% were detected prior to peak light, the channel is defined as suitable for peak classification (circles). Channels not fulfilling either criteria are marked with triangles. Left panel: full channel content. Channels are divided here according to those where transients in galaxies known to host AGNs are cut (black) and channels where these are accepted (gray); cf. Table 3. Right panel: comparison of the total number of accepted candidates (y-axis) with the number of comparison sample SNe Ia found, with only candidates linked to a galaxy with known spectroscopic redshift z < 0.1. All channels reject transients in host galaxies with known AGNs; cf. Table 4. Three channels further discussed in the main text are highlighted (red circles).
Current usage metrics show cumulative count of Article Views (full-text article views including HTML views, PDF and ePub downloads, according to the available data) and Abstracts Views on Vision4Press platform.
Data correspond to usage on the plateform after 2015. The current usage metrics is available 48-96 hours after online publication and is updated daily on week days.
Initial download of the metrics may take a while.