Fig. 2.
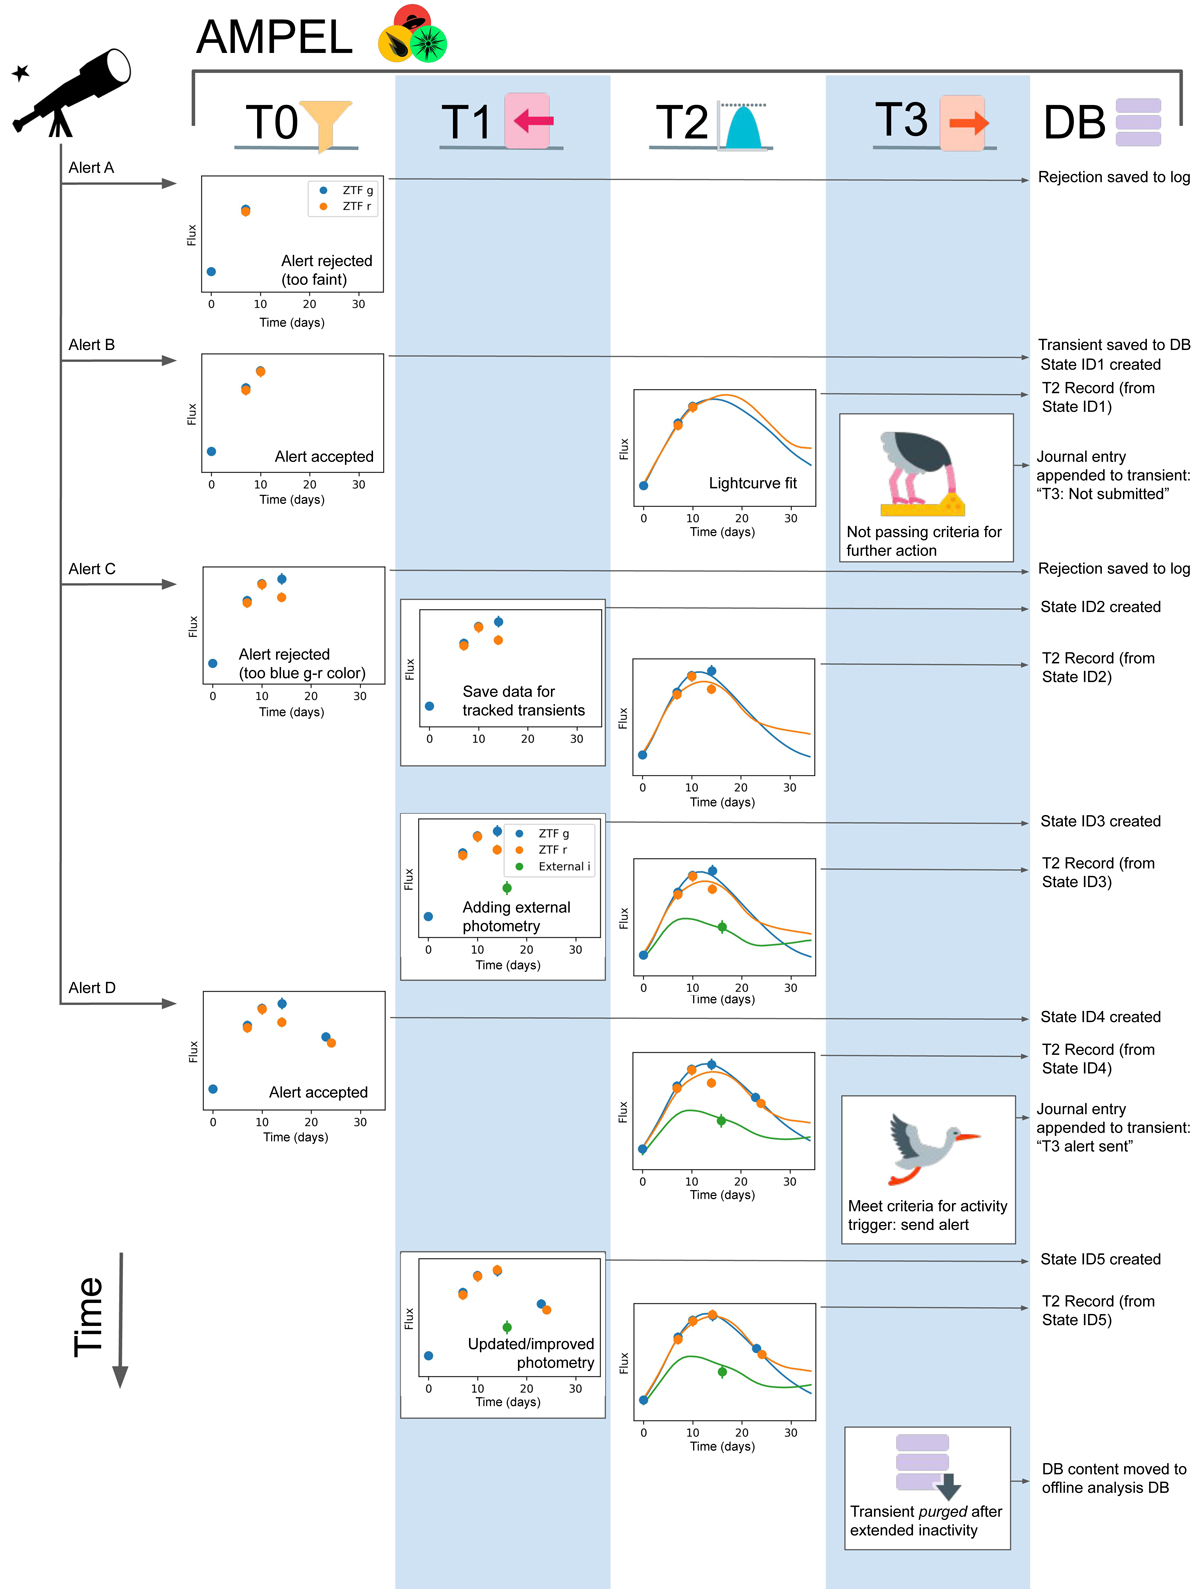
Life of a transient in AMPEL. Sample behavior at the four tiers of AMPEL as well as the database access are shown as columns, with the left side of the figure indicating when the four alerts belonging to the transient were received. T0: The first and third alerts are rejected, while the second and fourth fulfill the channel acceptance criteria. T1: The first T1 panel shows how the data content of an alert which was rejected at the T0 stage but where the transient ID was already known to AMPEL is still ingested into the live DB. The second panel shows an external datapoint (measurement) being added to this transient. The final T1 panel shows how one of the original datapoints is updated. All T1 operations lead to the creation of a new state. T2: The T2 scheduler reacts every time a new state is created and queues the execution of all T2s requested by this channel. In this case this causes a light-curve fit to be performed and the fit results are stored as ScienceRecords. T3: The T3 scheduler schedules units for execution at pre-configured times. In this example this is a (daily) execution of a unit testing whether any modified transient warrants a Slack posting (requesting potential further follow-up). The submit criteria are fulfilled the second time the unit is run. In both cases, the evaluation is stored in the transient Journal, which is later used to prevent a transient from being posted multiple times. Once the transient has not been updated for an extended time, a T3 unit purges the transient to an external database that can be directly queried by channel owners. Database: A transient entry is created in the DB as the first alert is accepted. After this, each new datapoint causes a new state to be created. T2 ScienceRecords are each associated with one state. The T3 units return information that is stored in the Journal.
Current usage metrics show cumulative count of Article Views (full-text article views including HTML views, PDF and ePub downloads, according to the available data) and Abstracts Views on Vision4Press platform.
Data correspond to usage on the plateform after 2015. The current usage metrics is available 48-96 hours after online publication and is updated daily on week days.
Initial download of the metrics may take a while.