Open Access
Fig. 7.
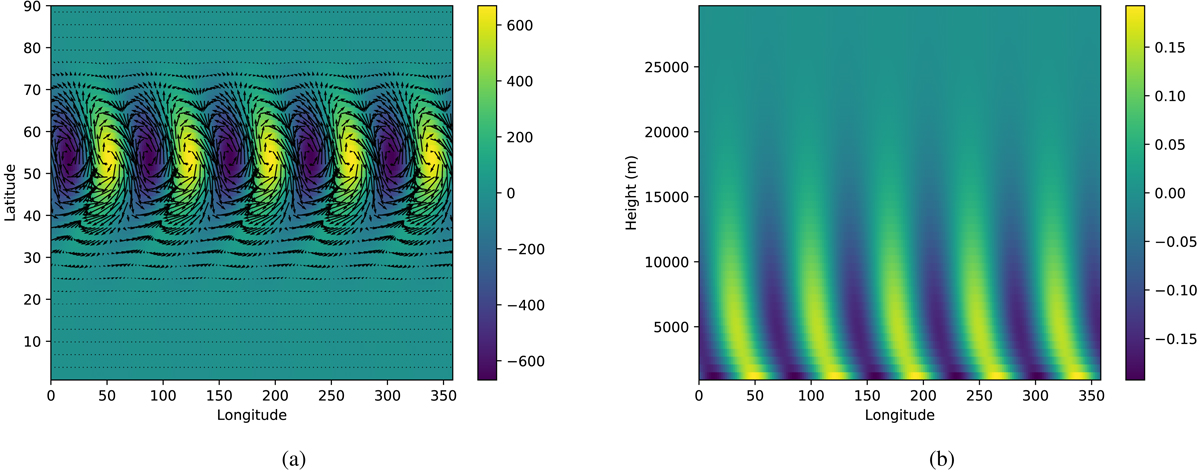
Pressure (colour scale, pascals) and horizontal winds (arrows panel a only) produced using ECLIPS3D, for the baroclinic instability setup of Ullrich et al. (2014). Panel a: near-surface pressure as a function of longitude and latitude. Panel b: pressure as a function of longitude and height at 50° latitude.
Current usage metrics show cumulative count of Article Views (full-text article views including HTML views, PDF and ePub downloads, according to the available data) and Abstracts Views on Vision4Press platform.
Data correspond to usage on the plateform after 2015. The current usage metrics is available 48-96 hours after online publication and is updated daily on week days.
Initial download of the metrics may take a while.