Fig. 2.
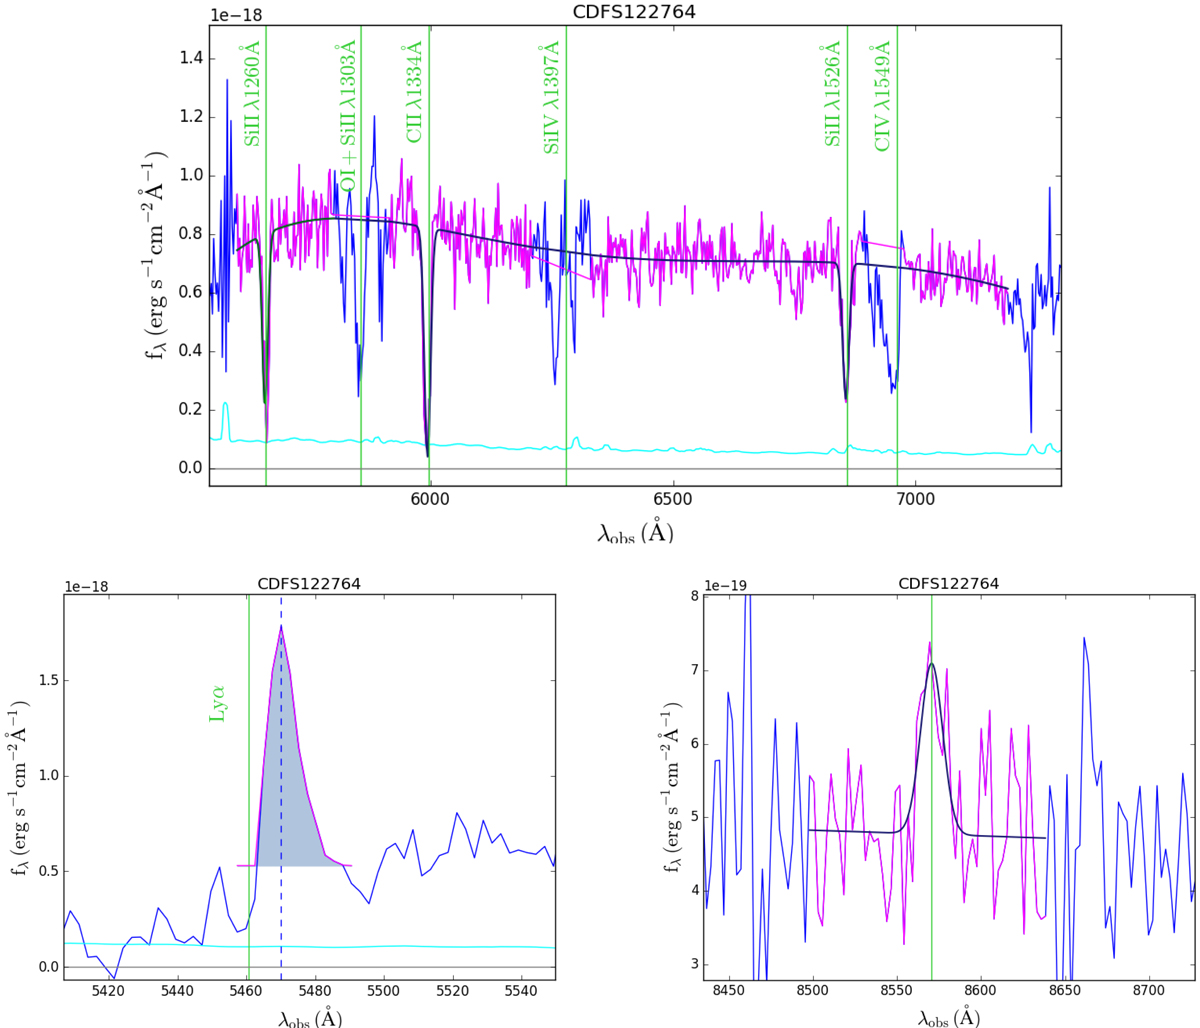
Different regions of the spectrum of object CDFS122764 at z = 3.49 are shown for reference. Upper panel: UV continuum between about 1250–1750 Å rest frame, where the most important absorption features are clearly visible, lower left panel: Lyα line profile, and lower right panel: CIII] λ1909 Å emission. We used the magenta parts of the spectrum to perform the fits. The dark blue lines in the upper panel and in the lower right panel are the best fits, and the shaded region in the lower left panel represents the normalized integrated flux of the Lyα that we used to evaluate the EW of the line. The vertical green lines show the positions of the lines at rest-frame air wavelength. The blue vertical dashed line in the lower left panel indicates the position of the Lyα peak. The cyan line is the VANDELS noise spectrum.
Current usage metrics show cumulative count of Article Views (full-text article views including HTML views, PDF and ePub downloads, according to the available data) and Abstracts Views on Vision4Press platform.
Data correspond to usage on the plateform after 2015. The current usage metrics is available 48-96 hours after online publication and is updated daily on week days.
Initial download of the metrics may take a while.