Fig. 12.
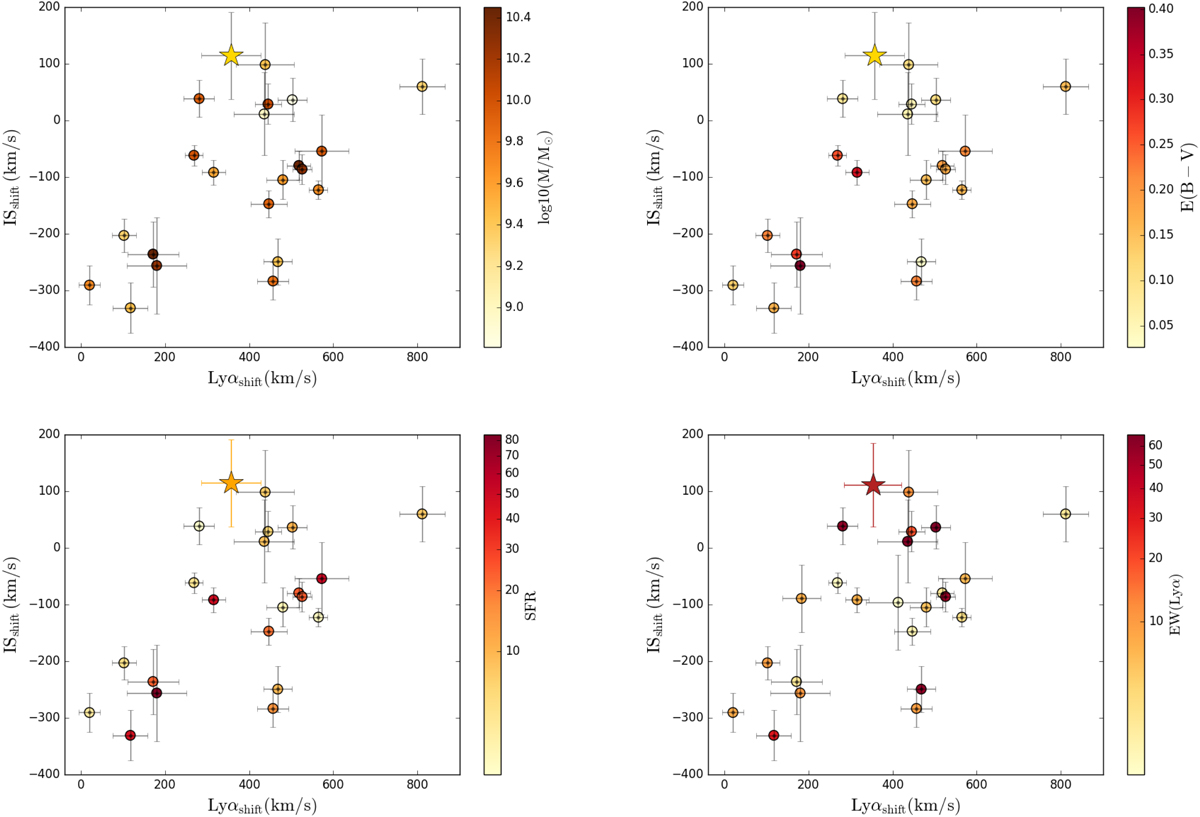
ISshift versus Lyαshift color-coded for different galaxy properties. From left to the right and top to bottom we show the stellar mass, E(B − V) color excess, SFR, and EW(Lyα). The star in each plot is the stack of the sources with no individual ISshift measure. The color is given by the median values of the measured quantity that is indicated in the color bar for the galaxies in the IS undetected sample.
Current usage metrics show cumulative count of Article Views (full-text article views including HTML views, PDF and ePub downloads, according to the available data) and Abstracts Views on Vision4Press platform.
Data correspond to usage on the plateform after 2015. The current usage metrics is available 48-96 hours after online publication and is updated daily on week days.
Initial download of the metrics may take a while.