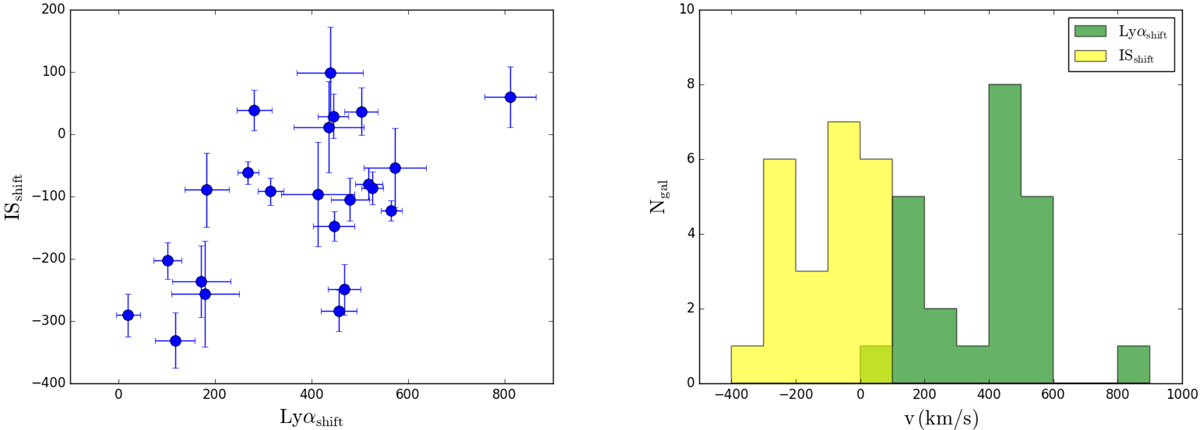
Fig. 10.

Left panel: anticorrelation between the velocity of the main peak of the Lyα profile with respect to the systemic redshift and the IS velocity shift. Right panel: histogram of the measured (centroid) velocities of interstellar absorption lines in yellow and Lyα emission in green with respect to the galaxy systemic redshift derived from the centroid of either the CIII]λ1909 Å or the HeIIλ1640 Å emission lines. The yellow sample contains only the 26 objects for which we were able to give a precise measure of the IS velocity shifts, and the green sample contains the 46 spectra where we were able to estimate the Lyα peak shift.
Current usage metrics show cumulative count of Article Views (full-text article views including HTML views, PDF and ePub downloads, according to the available data) and Abstracts Views on Vision4Press platform.
Data correspond to usage on the plateform after 2015. The current usage metrics is available 48-96 hours after online publication and is updated daily on week days.
Initial download of the metrics may take a while.


