Fig. 7
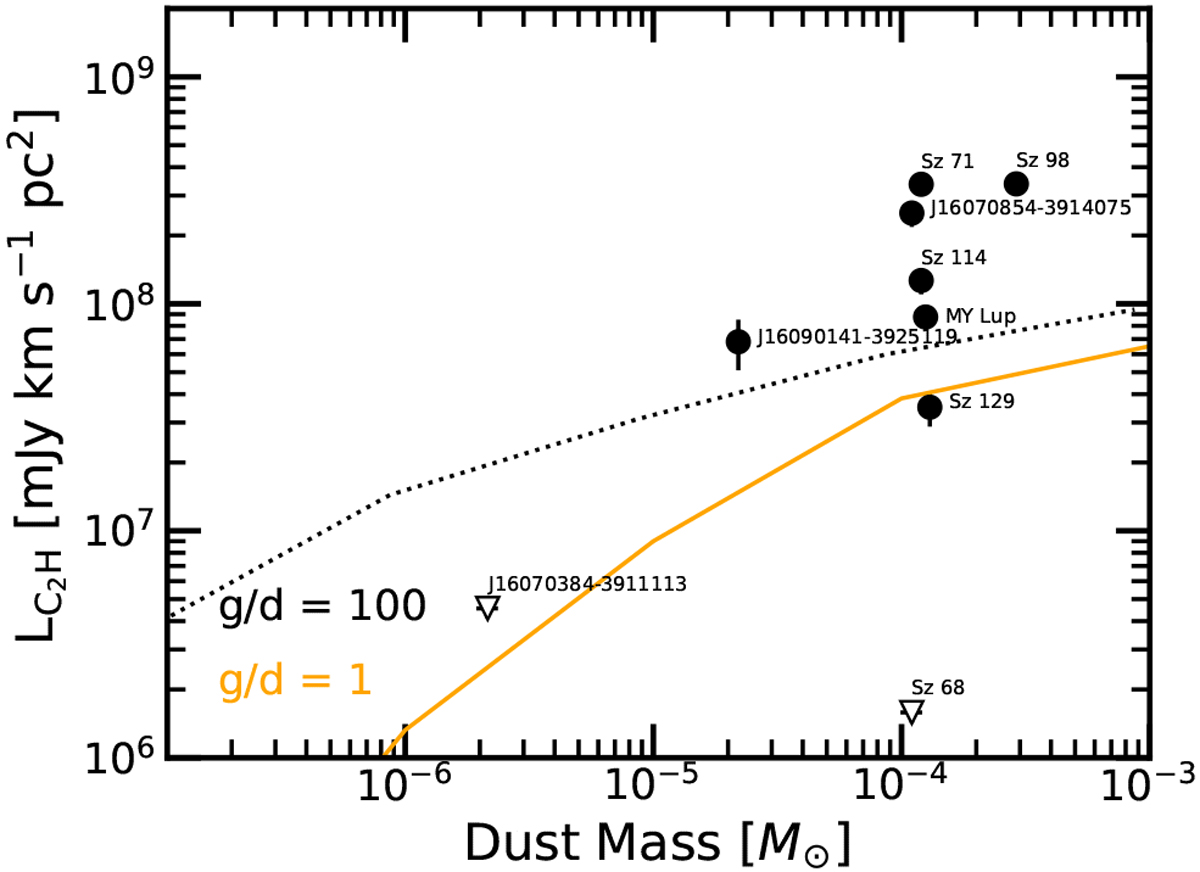
Simulated C2H integrated line luminosities using the code DALI (Bruderer et al. 2012) as functions of the disc dust mass compared with the Lupus observations. The dotted black line shows model results obtained assuming [C] and [O] ISM-like abundances and a gas-to-dust ratio of 100 (same as in panel a of Fig. 6). The solid orange line shows model results obtained decreasing the gas masses by two orders of magnitude, while keeping the dust mass fixed in order to obtain a gas-to-dust ratio of 1. Lupus detections are shown by the black circles, and non-detections by the empty triangles as 3-σ upper limits.
Current usage metrics show cumulative count of Article Views (full-text article views including HTML views, PDF and ePub downloads, according to the available data) and Abstracts Views on Vision4Press platform.
Data correspond to usage on the plateform after 2015. The current usage metrics is available 48-96 hours after online publication and is updated daily on week days.
Initial download of the metrics may take a while.