Fig. 4
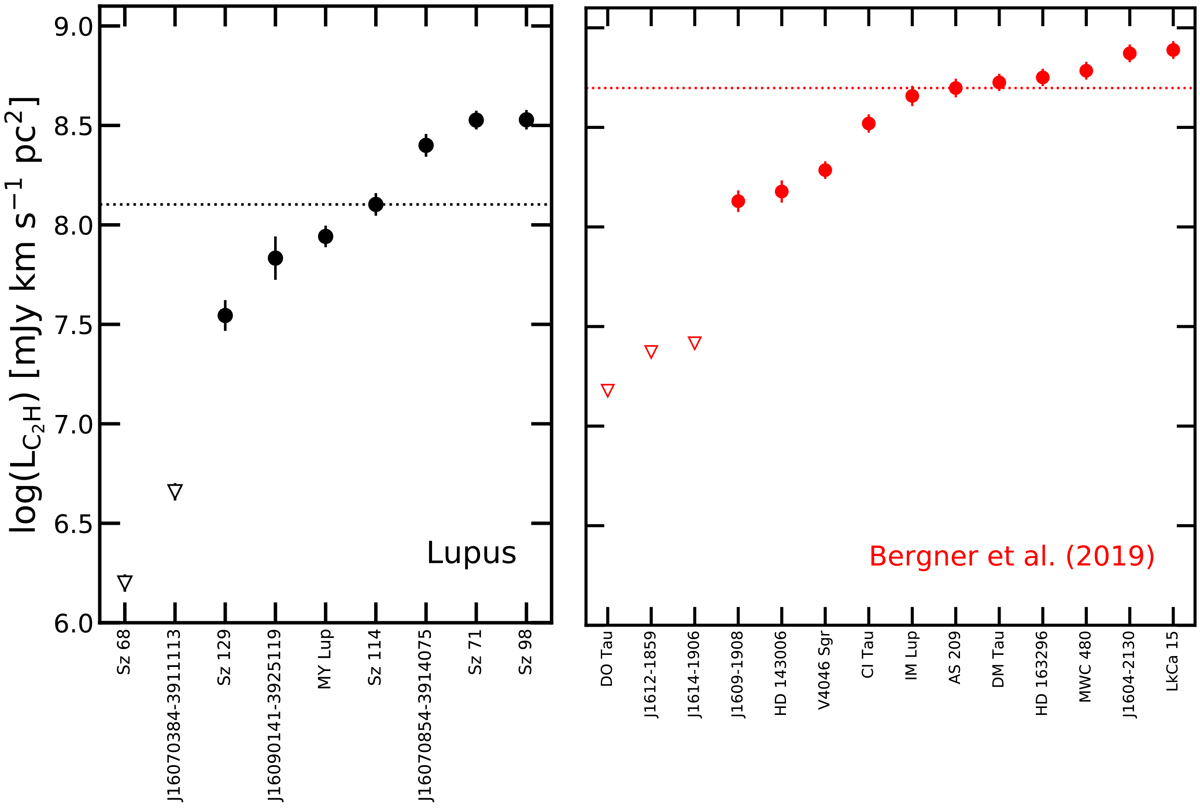
Logarithm of C2H (N = 3– 2, J = 7∕2–5∕2, F = 4–3 and F = 3–2) integrated line luminosity of the new Lupus observations presented in this paper in black (left panel) and of the discs presented by Bergner et al. (2019) in red (right panel). Empty triangles show the C2H non-detections as 3-σ upper limits.The dotted lines show the median integrated C2H line luminosity of the detected Lupus discs, in black, and of the detected additional sources, in red. We note the much larger dynamic range of our ALMA data.
Current usage metrics show cumulative count of Article Views (full-text article views including HTML views, PDF and ePub downloads, according to the available data) and Abstracts Views on Vision4Press platform.
Data correspond to usage on the plateform after 2015. The current usage metrics is available 48-96 hours after online publication and is updated daily on week days.
Initial download of the metrics may take a while.