Fig. 3
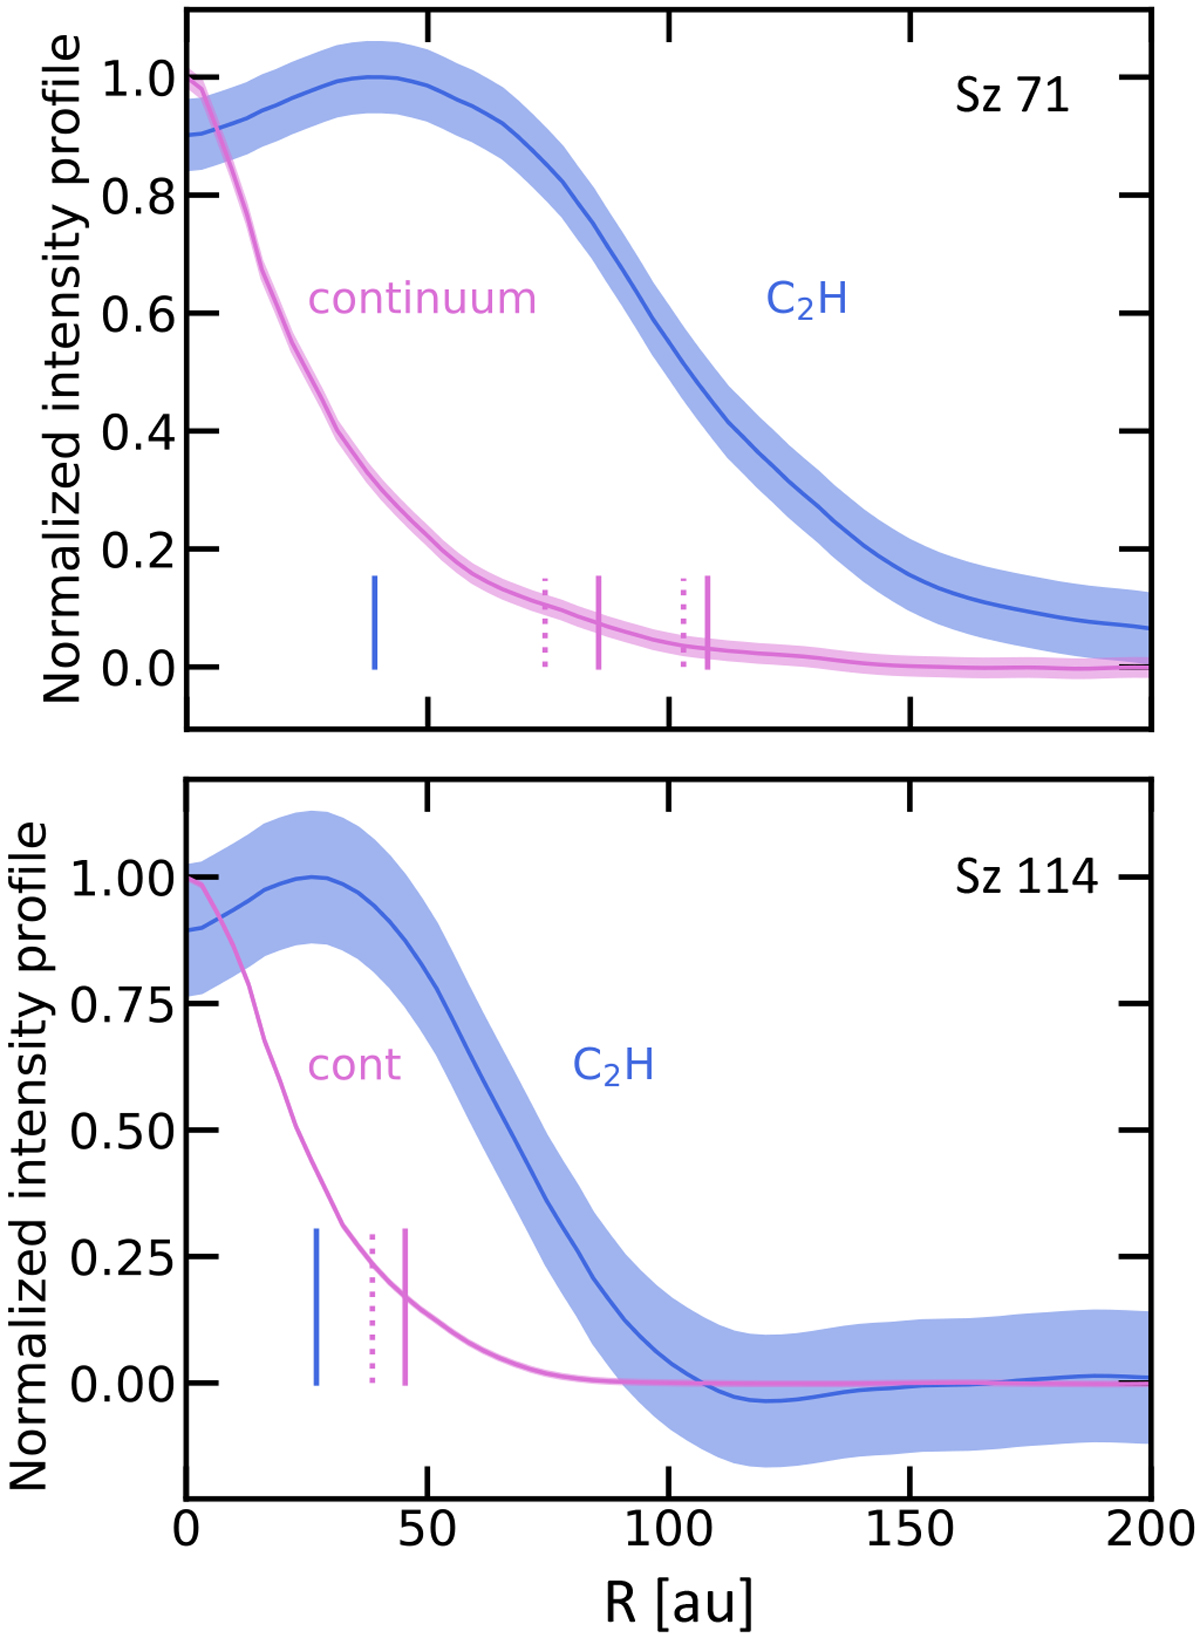
Azimuthally averaged normalised brightness profiles of the C2H (blue) and 1.2 mm continuum (pink) emission as functions of disc radius for Sz 71 (top panel) and Sz 114 (bottom panel). The blue vertical lines show the peak location of the C2H emission, while the dotted and solid pink lines show respectively the location of the gaps and rings detected in these discs by Huang et al. (2018) with higher-angular-resolution ALMA data (DSHARP large program; Andrews et al. 2018).
Current usage metrics show cumulative count of Article Views (full-text article views including HTML views, PDF and ePub downloads, according to the available data) and Abstracts Views on Vision4Press platform.
Data correspond to usage on the plateform after 2015. The current usage metrics is available 48-96 hours after online publication and is updated daily on week days.
Initial download of the metrics may take a while.