Free Access
Fig. B.1
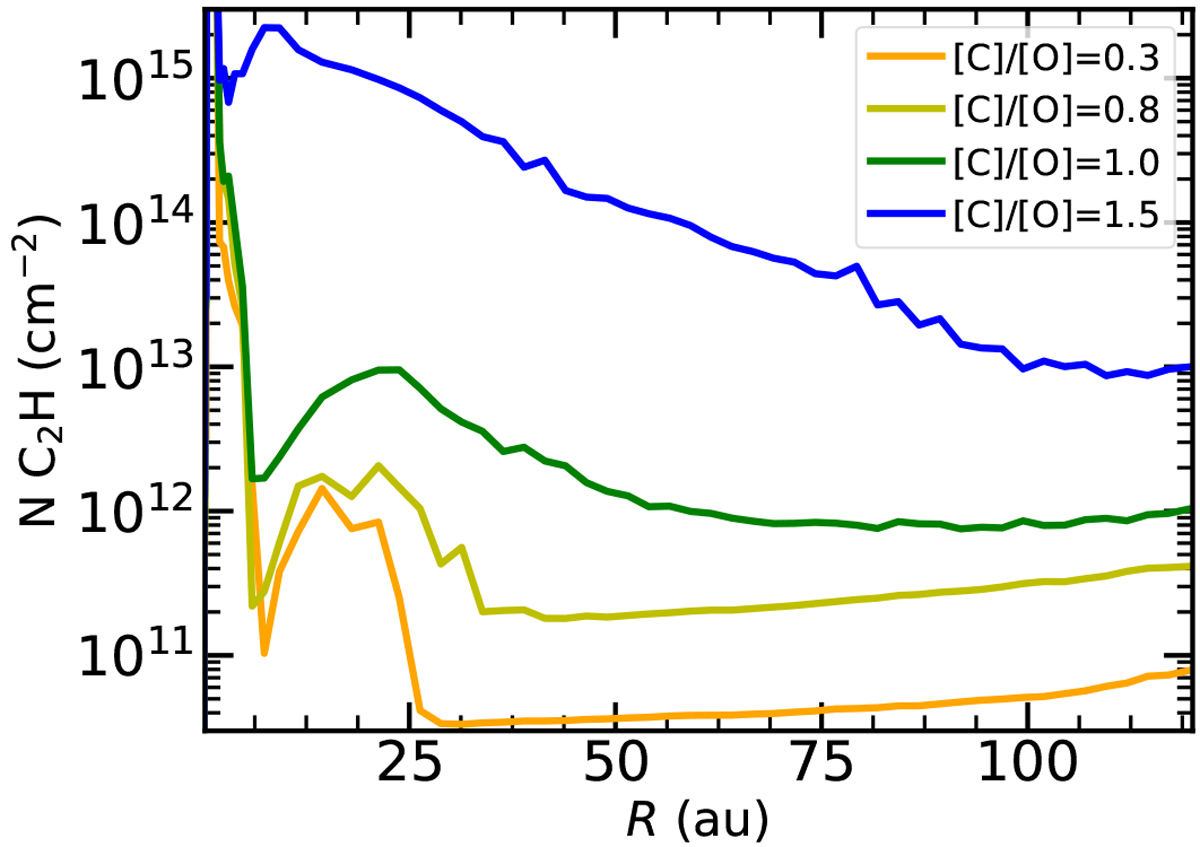
C2H column densities as a function of the disc radius obtained with DALI for a 10−2 M⊙ disc. Volatile C abundance is reduced by two orders of magnitude and O abundance is decreased by the same value or more in order to obtain [C]/[O] ratios of 0.3 (orange line), 0.8 (light green line), 1.0 (green line) and 1.5 (blue line).
Current usage metrics show cumulative count of Article Views (full-text article views including HTML views, PDF and ePub downloads, according to the available data) and Abstracts Views on Vision4Press platform.
Data correspond to usage on the plateform after 2015. The current usage metrics is available 48-96 hours after online publication and is updated daily on week days.
Initial download of the metrics may take a while.