Fig. 8
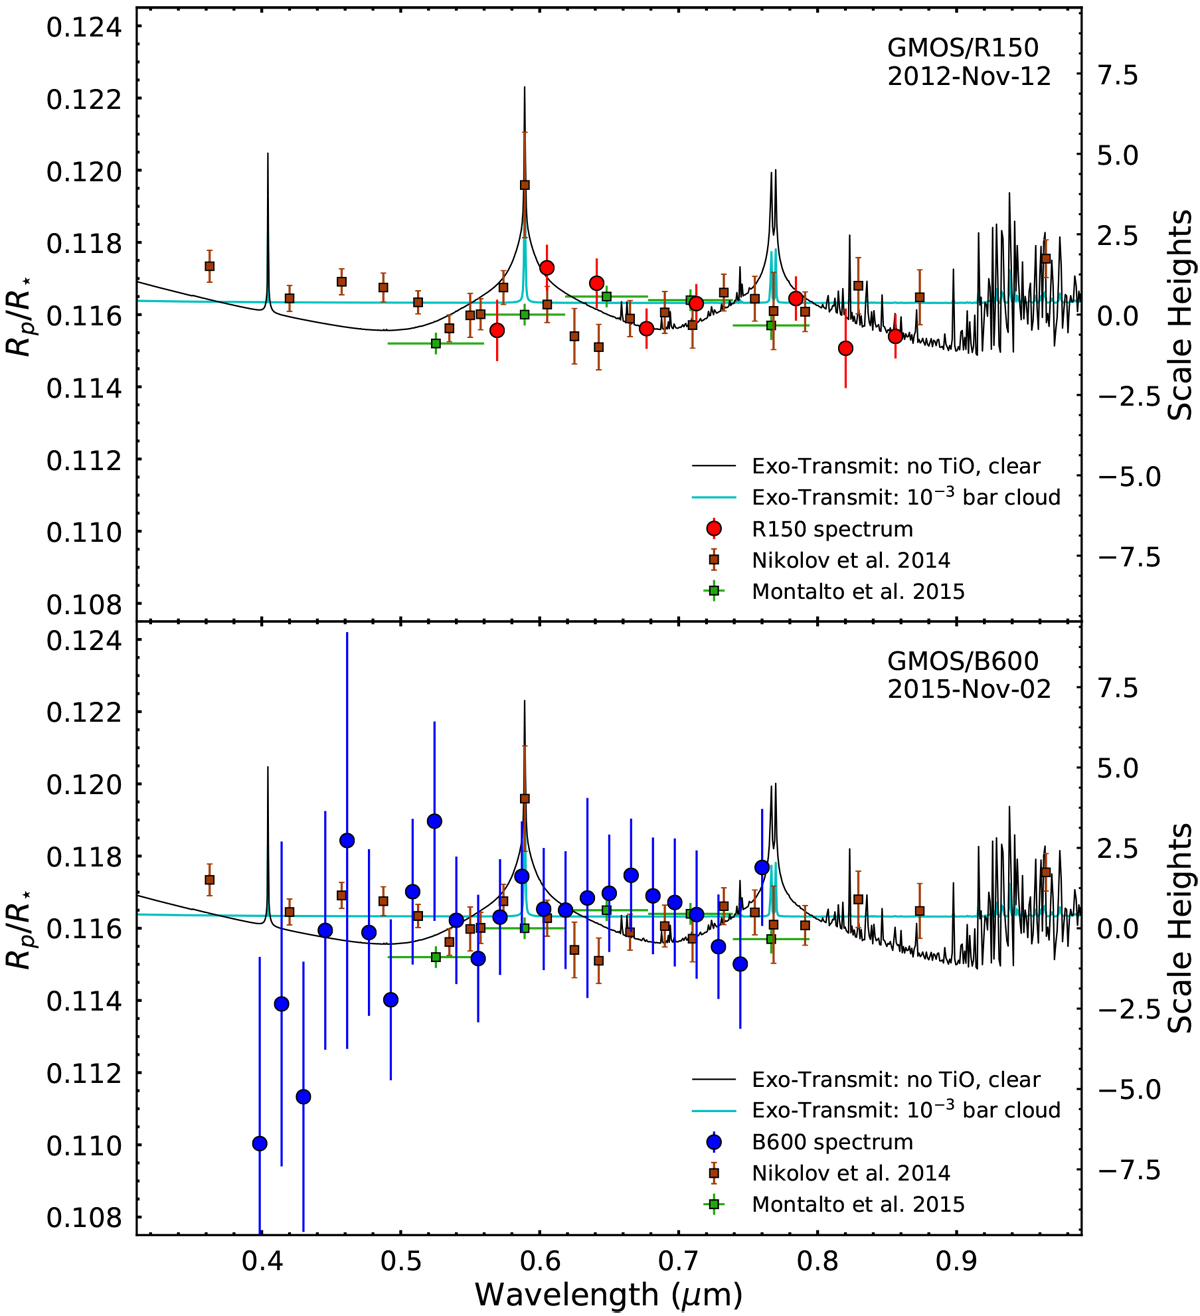
R150 (top) and B600 (bottom) transit spectra from this work, compared to the results of Nikolov et al. (2014) and Montalto et al. (2015). The bluest wavelengths in the B600 spectrum are strongly affected by high airmass, and this spectrum as a whole has little constraining power on atmospheric models. The R150 measurements near 750 nm and ≳ 850 nm could be affected by additional correlated noise effects of strong and variable telluric absorption by O2 and H2O, respectively. We therefore exclude these transit measurements from our analysis and this figure. We compare the resulting transit spectrum to an exo-transmit model with clear atmosphere and no TiO/VO (black lines), which, based on our observations, is marginally favored over cloudy models, which are essentially flat lines (cyan lines). The model that does not include gas condensation and contains TiO/VO (not shown for clarity) is marginally disfavored by the R150 data. The R150 measurements have comparable uncertainties to the HST/STIS measurements (brown squares) for wavelength bin sizes of of tens of nanometers.
Current usage metrics show cumulative count of Article Views (full-text article views including HTML views, PDF and ePub downloads, according to the available data) and Abstracts Views on Vision4Press platform.
Data correspond to usage on the plateform after 2015. The current usage metrics is available 48-96 hours after online publication and is updated daily on week days.
Initial download of the metrics may take a while.