Fig. 7
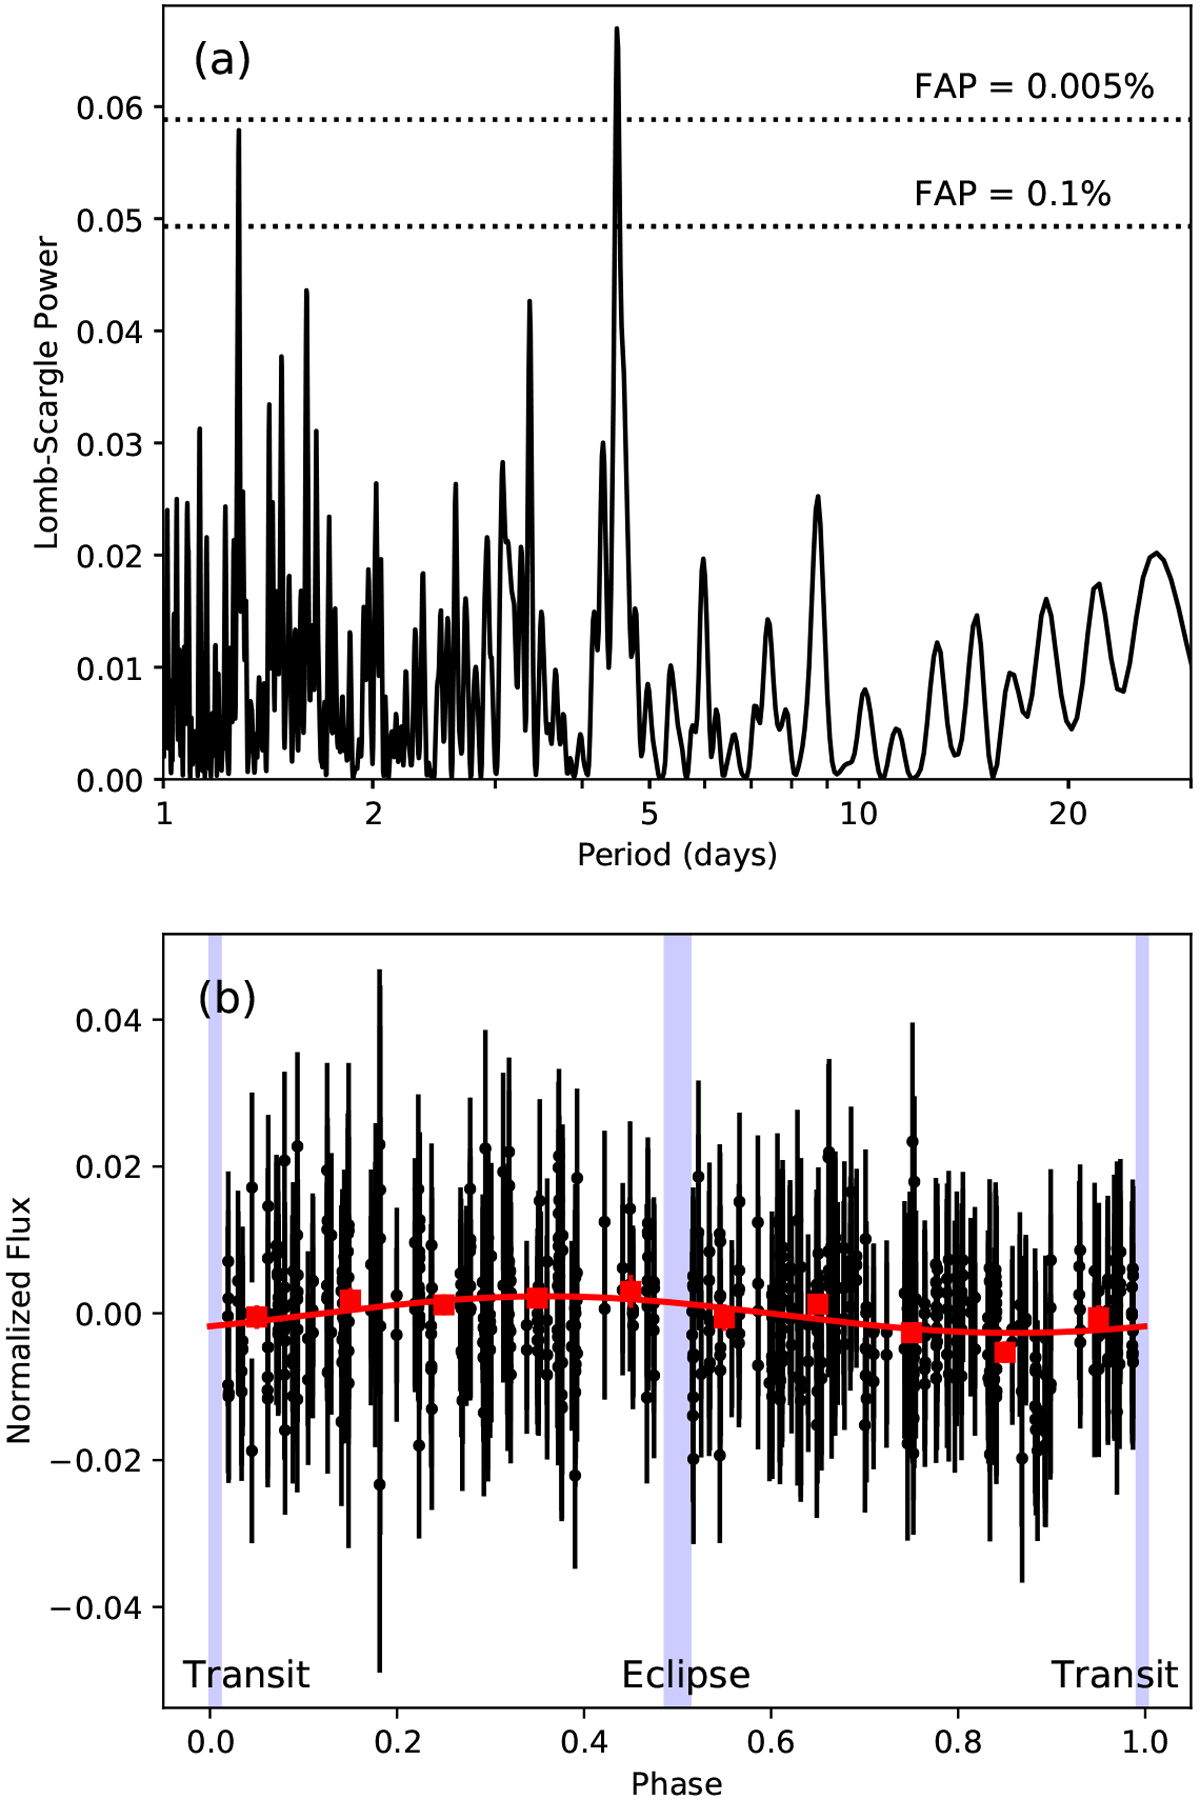
Panel a: Lomb-Scargle periodogram of our LCO B-band long-term photometric monitoring of HAT-P-1b (in-transit and in-eclipse measurements excluded). The only interesting peak in the periodogram, near 4.4866 days, with an FAP of ~ 4 ppm, corresponds to the orbital period of the planet. The other significant peak, near 1.3 days, is likely an alias of the LCO photometriccadence (typically one measurement every eight hours). The rotation period of the star is expected to be ≲ 15 days. Panel b: our stellar photometry folded to the period of the planet (4.465 days) and fit with a sine curve. Red squares represent the photometry binned to ~ 11 h (0.1 of the orbital period of the planet). The variation (minimum to maximum) is about 0.5%, which is smaller than the transit depth. It varies slowly and therefore probably does not affect our transit spectrum measurements. The timings of the transit and the secondary eclipse are marked.
Current usage metrics show cumulative count of Article Views (full-text article views including HTML views, PDF and ePub downloads, according to the available data) and Abstracts Views on Vision4Press platform.
Data correspond to usage on the plateform after 2015. The current usage metrics is available 48-96 hours after online publication and is updated daily on week days.
Initial download of the metrics may take a while.