Free Access
Fig. 5
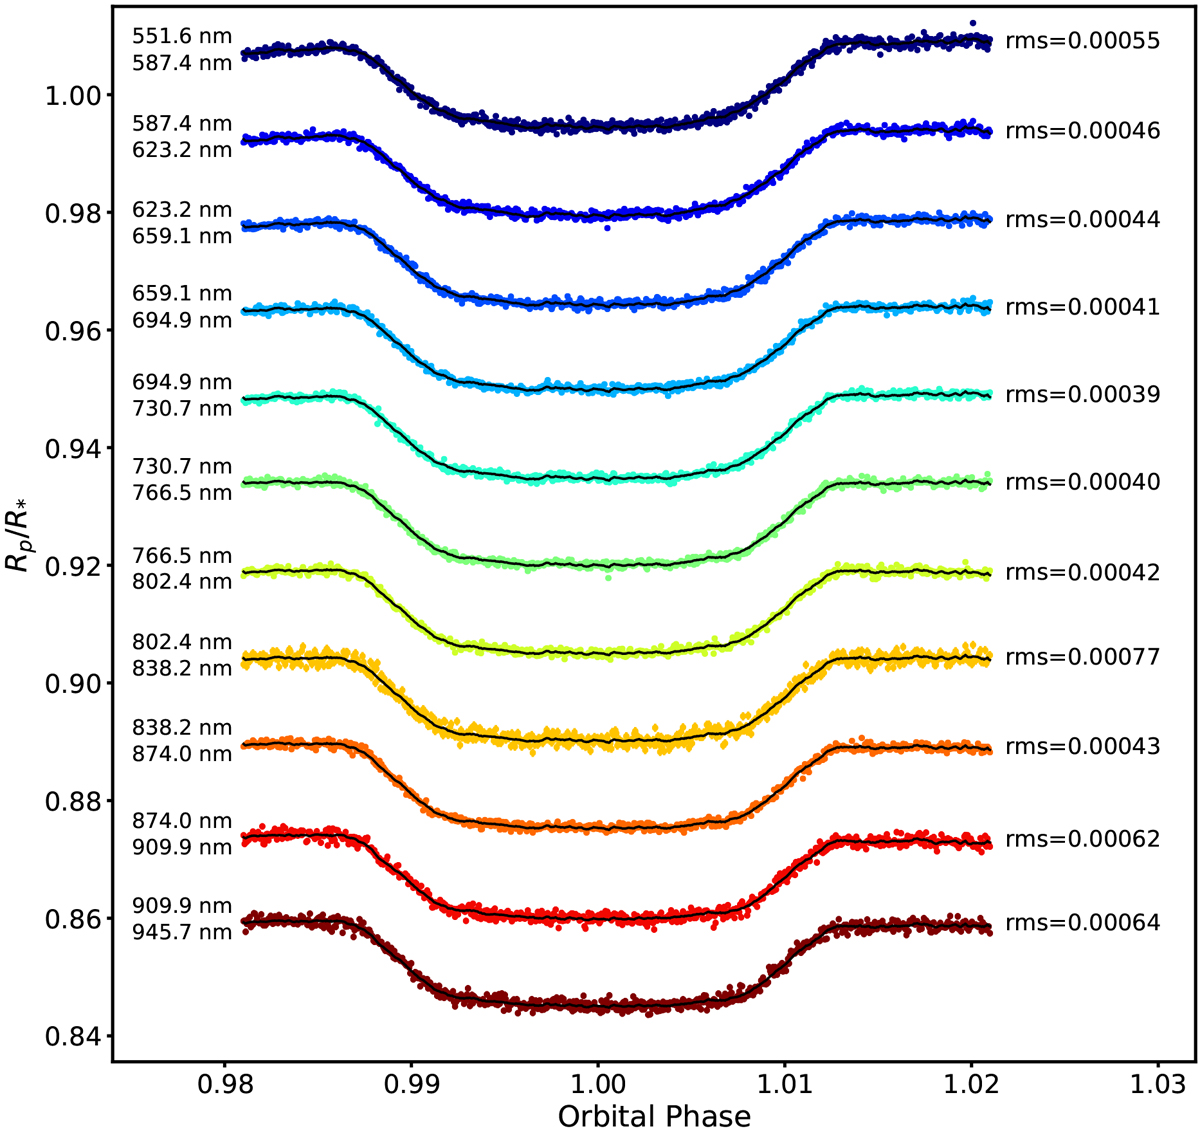
R150 light curves in each wavelength bins (labeled) and the best-fit transit models (black lines). We indicate the rms values of the residuals between observation and model in order to quantify the scatter in each wavelength bin.
Current usage metrics show cumulative count of Article Views (full-text article views including HTML views, PDF and ePub downloads, according to the available data) and Abstracts Views on Vision4Press platform.
Data correspond to usage on the plateform after 2015. The current usage metrics is available 48-96 hours after online publication and is updated daily on week days.
Initial download of the metrics may take a while.