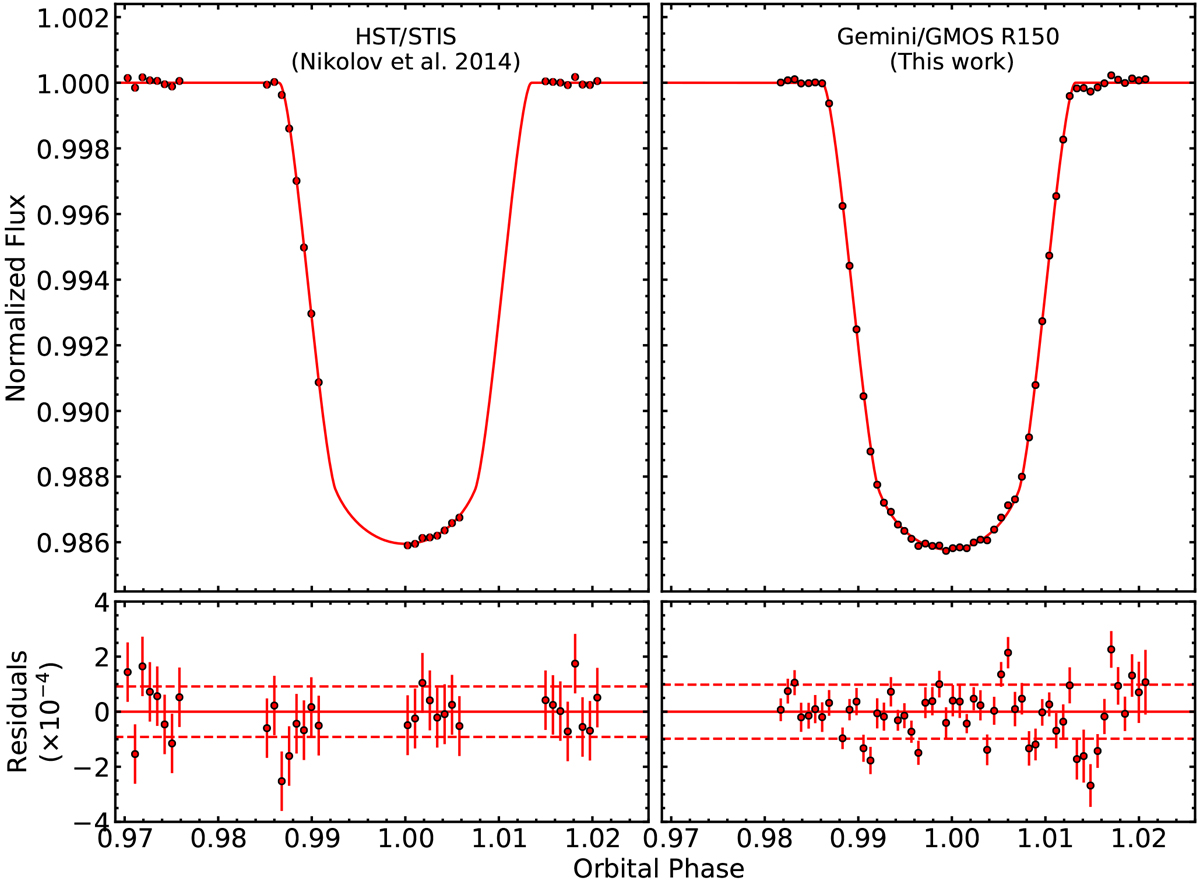
Fig. 4

Comparison of the GMOS R150 transit white-light curve (right panels, 4σ outliers removed) after correction for systematic effects to a corrected HST/STIS optical white-light curve (left panels, Nikolov et al. 2014). The HST transit was observed on 2012 May 30 (Visit 20) with the G750L grating (524– 1027 nm). The GMOS R150 white-light curve is binned to match the HST integration time (284 s). In the white-light curves, the scatter of the residuals is comparable between the two instruments. The rms of the residuals (dashed lines) is 90 ppm (HST/STIS) and 100 ppm (Gemini/GMOS), but GMOS can observe the transit continuously, while HST observations have gaps because the spacecraft orbits Earth. While the R150 observation is comparable in precision to that with HST/STIS, the B600 observation (not shown) is subject to more complex systematic effects and the corresponding rms of the residuals and the uncertainties in the transit parameters is higher than for space-based observationsat similar wavelengths.
Current usage metrics show cumulative count of Article Views (full-text article views including HTML views, PDF and ePub downloads, according to the available data) and Abstracts Views on Vision4Press platform.
Data correspond to usage on the plateform after 2015. The current usage metrics is available 48-96 hours after online publication and is updated daily on week days.
Initial download of the metrics may take a while.


