Fig. 3
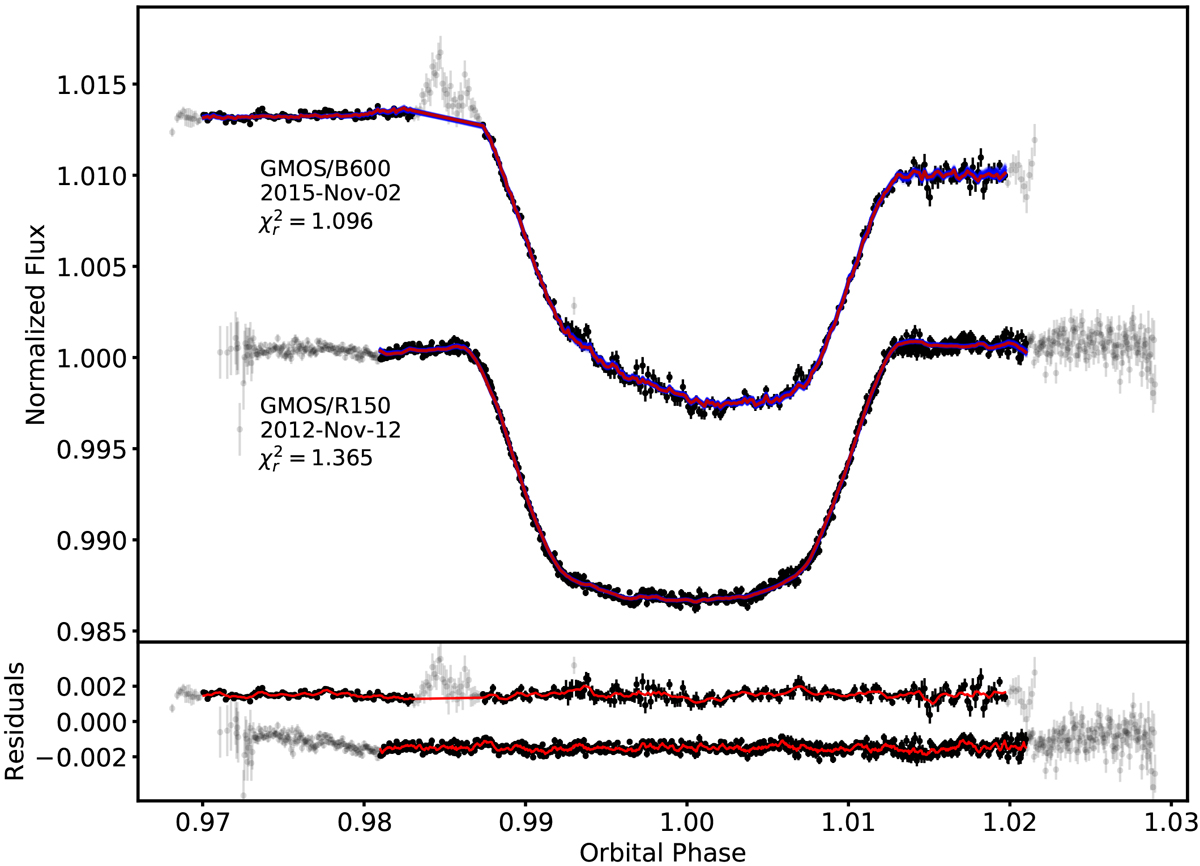
White-light curves of the transits observed with the B600 and R150 grating spectral time series integrated over wavelength between 330 and 770 nm and 550 and 950 nm, respectively. Gray points indicate poor-quality data excluded from the analysis. The anomalous peak near phase 0.987 in the B600 light curve has an amplitude of about 0.5% and represents a defect in the light curve, likely caused by rapid change in the wind at the observatory site, correlated with a spike in the PSF FWHM (Fig. 2). Near phase 0.987, we exclude the part of the spectral time series with anomalously broad PSFs. The R150 light curve appears to be better behaved and displays no large-scale irregularities, but the initial hour of the light curve is difficult to account for with our model of systematic effects. We drop it from the analysis, along with the final ~ 45 min, which were obtained at high airmass and have a large scatter. The red lines represent the best-fit model of the transit and systematic effects for the white-light curve (top) and the smoothed residuals to highlight any residual red noise (bottom). The faint blue lines in the top panel represent sample model instances from the converged MCMC chains.
Current usage metrics show cumulative count of Article Views (full-text article views including HTML views, PDF and ePub downloads, according to the available data) and Abstracts Views on Vision4Press platform.
Data correspond to usage on the plateform after 2015. The current usage metrics is available 48-96 hours after online publication and is updated daily on week days.
Initial download of the metrics may take a while.