Fig. 2
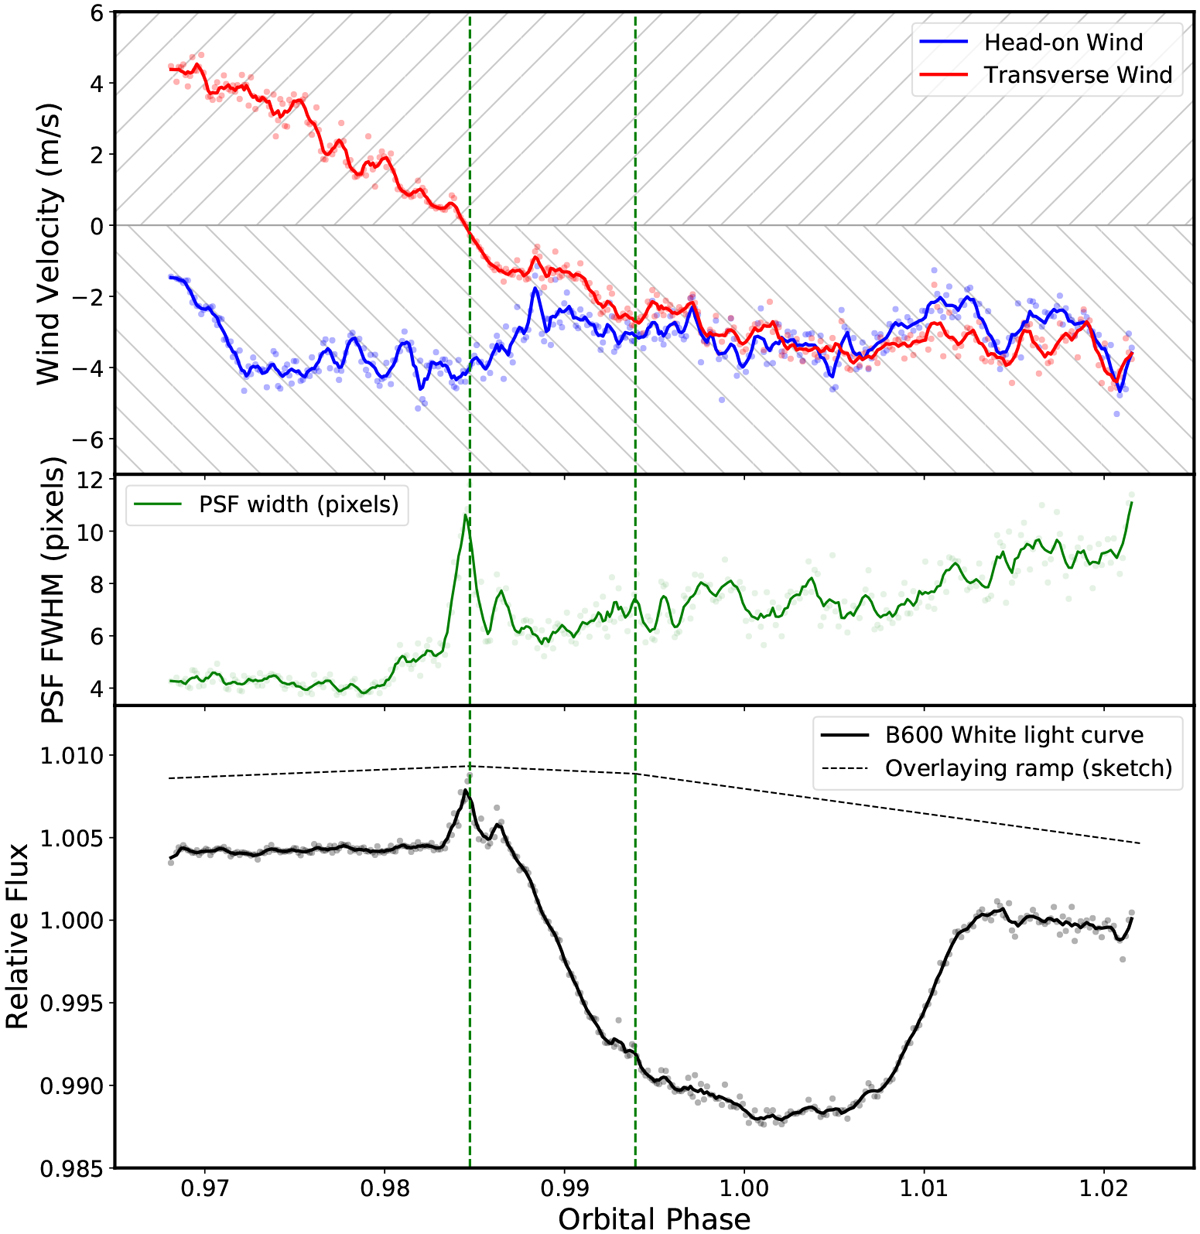
Top: wind velocity and direction during the B600 transit observation, with respect to the current pointing vector of the telescope. The transverse wind component (red) comes from the right when positive and from the left when negative in the observer reference frame because it follows the target star during the night. The head-on wind component (blue) comes from the observer’s back when negative and from the front when positive. The transverse wind component coming from the right drops to zero near phase of 0.987 and then again increases in strength, but from the other direction. The head-on component of the wind remains fairly constant throughout the observation with respect to the dome opening, and always returns from the back of the observer. Middle: median PSF FWHM for each exposure throughout the observation, showing a spike of a factor of ~ 2 near phase 0.987, which coincides with the change in direction in the transverse wind component. The overall gradual increase in the FWHM beyond this point is likely caused by worsening seeing caused by the increasing airmass of the observation. Bottom: B600 white-light curve (black solid line) and a sketch of the ramp we use to correct the overall slopes. The green dotted vertical lines represent the two defects in the light curve that appear to cause changes in the baseline slope. The defect near 0.987 is likely induced by the change in the wind direction, while the cause of the other remains unclear.
Current usage metrics show cumulative count of Article Views (full-text article views including HTML views, PDF and ePub downloads, according to the available data) and Abstracts Views on Vision4Press platform.
Data correspond to usage on the plateform after 2015. The current usage metrics is available 48-96 hours after online publication and is updated daily on week days.
Initial download of the metrics may take a while.